Social and Spatial Epidemiology Unit members Sarah McKetta and Katherine Keyes recently published research in PloS Medicine regarding national trends in binge and heavy drinking.
A wave of recent media attention has raised alarms that women with children are drinking more. So-called “mommy drinking” reports have largely circulated within the mommy blogosphere and lifestyle media, with reports citing concerns about “mommy wine time,” “mommy juice,” and associated branding of alcohol consumption as self-care. No empiric research has actually examined whether moms are actually drinking more.
McKetta and Keyes used data from the National Health Interview Survey (NHIS) from 2006 to 2018 to examine trends in drinking for moms. Because drinking trends in recent decades have varied by gender and age as well, they looked at 3 different age groups (18-29, 30-44, 45-55) as well as men and women, according to parenting status. The alcohol use outcomes they considered were past-year binge drinking—defined as 5 or more drinks per day for men, 4 or more for women—and heavy drinking, defined as 60 or more binge episodes per year, or an average of 5 or more per month. They also considered trends in abstaining from drinking, because measurement of binge drinking changed for women (from 5 to 4 or more drinks per day) during the study period, and looking at abstinence allowed us to confirm that binge trends weren’t an artifact of measurement variance.
They found that in general, men report higher rates of binge and heavy drinking than women, and people without kids report higher rates of binge and heavy drinking than those who have kids. So, moms overall had the lowest rates of binge and heavy drinking in all age categories.
However, looking at trends over time (figure below), women increased their rates of binge drinking from 2006 to 2018 at higher rates than men. In fact, the youngest men (ages 18-30) declined their binge drinking rates, while all women evidenced increases.
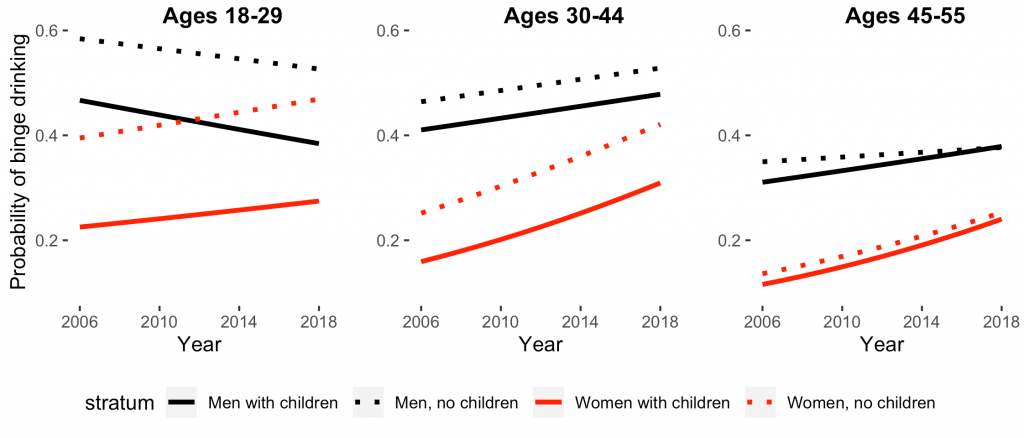
The increases in women’s binge drinking through time were not differential by parenting status. The probability of binge drinking increased among moms over the years, but these increases through time paralleled those seen among women without children.
Nearly everyone decreased heavy drinking or remained at the same rates over the study period, suggesting that while more women were binging at least once per year, they were not binging repeatedly. Trends in abstinence closely mirrored trends in binge drinking for all groups: as binge drinking increased, abstinence declined; abstinence increased only among young men, who also decreased binge drinking.
In sum, it seems that we don’t need to be worrying about binge drinking specifically for moms; we need to be worrying about binge drinking for all adults. Alcohol is a leading cause of preventable mortality and morbidity, and binge episodes increase risks of injury and death. The group traditionally considered high risk for binge drinking – young, college-aged men—are the only ones who have decreased rates of binge drinking, and childless young men nevertheless binge drink at the highest rates of anyone. These trends are worrying, and physicians should be screening all patients for alcohol consumption.