Social support and intimate partner violence in rural Pakistan: a longitudinal investigation of the bi-directional relationship

While there are well-established links between social support and intimate partner violence (IPV), the directionality of this relationship has not been firmly established due to a dearth of longitudinal evidence. Using data from the Bachpan cohort study, a unique study that collected extensive social, demographic, mental health, and IPV information from women in rural Pakistan, Dr. Robin Richardson and collegues investigated the longitudinal association between IPV severity and social support. The full paper was published in SSM Population Health and the full text is here.

This work used comprehensive information about perceived friend and family support, measured with the Multidimensional Perceived Social Support Scale, and extensive information about women’s experiences of physical, psychological, and sexual IPV, which was measured with the World Health Organization’s Violence Against Women Instrument. The authors summarized IPV severity using an advanced measurement technique (confirmatory factor analysis). To compare the magnitude of relationships, the authors rescaled both IPV severity and social support so that they had the same score range, which is one innovation of this study. The analysis encompassed data from 945 women who were followed for three years.

In linear regression models that included a 12-month lag between exposure and outcome and controlled for a number of potential confounding factors, the authors found evidence of a bi-directional relationship between IPV severity and social support. Specifically, higher IPV severity led to reductions in both friend and family support, and higher family support led to reductions in IPV severity, although friend support did not.

Longitudinal associations between social support and IPV severity among women in Pakistan (n = 945)

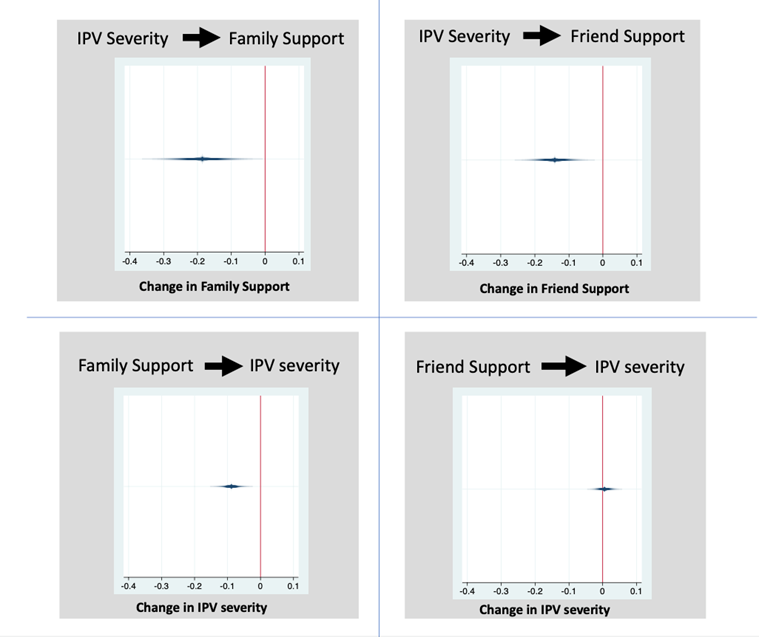
Models controlled for interviewer, household asset score, educational level, age, age at marriage, family structure, treatment arm, family support, Adverse Childhood Experiences, depressive symptom score, total number of living children, and total number of living sons.

This study provides some of the most comprehensive information to-date on this relationship, as it is the first to assess the directionality between specific types of social support and IPV using the same dataset, and – by providing similar scaling of both IPV and social support – allows for a comparison of the magnitude of associations. Using this similar scaling revealed that IPV severity led to larger reductions in social support, when compared with the magnitude of the effect of social support on reductions in IPV severity. Interestingly, the authors’ search of the literature showed that the majority of cross-sectional studies in low- and middle-income country settings infer a relationship in the opposite direction, that high levels of social support reduce IPV. This finding suggests that IPV may have an under-acknowledged role in reducing social support.

This careful analysis revealed that family support may reduce IPV severity, whereas friend support may not. This result has important implications for the design of IPV-related interventions in Pakistan and similar contexts: in particular, study results indicate that IPV interventions that integrate family support may be especially effective at reducing IPV, whereas those solely focusing on friend support may be less effective. Third party intervention strategies, which rely upon community members to intervene when they witness abuse, have gained popularity recently, and these study results suggest that interventions may be especially effective if they include or emphasize third party intervention from family members.

Broadly, these results describe how social support and IPV may be intertwined in one context. This work underscores the important role that family support may play in mitigate IPV risk, and suggests that IPV interventions integrating family members may be especially effective.


Dr. Richardson was a Postdoctoral Research Fellow in the Psychiatric Epidemiology Training Program at Columbia University when the research was performed and is now starting a position at Emory.

Posted in Intimate Partner Violence | Leave a comment

Overflowing Disparities: Examining the Availability of Litter Bins in New York City

The 1980s marked the birth of the modern environmental justice movements thanks to civil rights activists’ concerns about the disproportionate placements of landfills in low-income and Black communities. (see our Environmental Justice Spotify playlist here) Similar environmental injustice concerns are being voiced today about disparities in street litter bin availability in New York City (NYC). In 2018, Harlem neighborhood residents and community leaders raised sanitation and public health concerns when the NYC Sanitation Department removed 223 litter bins. The problem persisted two years after residents initially raised these concerns, and Harlem residents had increasing concerns about overflowing litter bins and street litter.

Previous research has documented associations between decreases in litter bin availability and increased street litter. There are numerous neighborhood health implications to excessive trash and street litter (e.g., increased vector-borne diseases, increased asthma/allergic reactions, and decreased ecological health). As such, disparities in litter bin availability pose a public health problem. New research by Nadav Sprague, Ariana Gobaud, Christina Mehranbod, Christopher Morrison, Charles Branas, and Ahuva Jacobowitz is the first study to examine the environmental injustice of limited street litter bins availability.

The study, recently published in the International Journal of Environmental Research and Public Health, examines the association between neighborhood median household income and litter bin availability in NYC. The study used publicly available data from NYC’s Department of Sanitation for litter bin availability and the US Census Bureau for data on neighborhood demographic data. The authors used Multilevel Bayesian conditional autoregressive Poisson models to examine the count of litter bins by median household income in each census tract. Bivariate associations identified that census tracts with higher median household incomes had more litter bins than census tracts with lower median household incomes. The authors then accounted for spatial autocorrelation by adding a conditional autoregressive random effect to the Multilevel Bayesian conditional autoregressive Poisson model. Spatial autocorrelation is the phenomenon that arises because nearby census tracts are more likely to have similar values than distal census tracts. Once the authors accounted for spatial autocorrelation, the relationship between median household income and litter bin availability was no longer significant.

Further research is necessary to identify the spatially structured condition that accounted for the observed effect. Additionally, while it may quantitatively appear that NYC might be equitably distributing litter bins, the perceptions of litter bin availability at the local level are equally important. Research suggests that environmental health perceptions equally affect health outcomes as actual exposures. Additional qualitative and quantitative research is warranted to understand community members’ perceptions of litter bin availability disparities. Overall, this preliminary study warrants further investigation of perceived and actual disparities in litter bin availability.

Posted in Economic, Environmental Justice, Physical Disorder, Racism, Social Environments, Socioeconomic Status, Urban Health | Leave a comment

In New York City, pandemic policing reproduced familiar patterns of racial disparities

In the past month, New York City has rolled back most of the public health mandates first put in place to control the spread of COVID-19 in early 2020, such as social distancing and mask wearing mandates. Now, new research Sandhya Kajeepeta, Emilie Bruzelius, Jessica Ho, and Seth Prins, documents the unintended consequences of using police to enforce these mandates, suggesting that pandemic policing produced and exacerbated racialized health inequities during the pandemic.

Using publicly available data from the NYPD, along with information on city-reported social distancing complaints and neighborhood mobility, we examined spatial patterns in public health policing in the early part of 2020. Results indicated that zip codes with higher percentages of Black residents experienced higher rates of public health related police contact—including COVID-related criminal court summonses and arrests—compared to neighborhoods with fewer Black residents. This relationship persisted even after controlling for zip code 311 social distancing complaints and time spent out of the home measured by cell-phone mobility data, two proxy measures of local non-compliance with social distancing requirements.

In fact, one of the strongest predictors of a neighborhood’s rate of pandemic policing was its historical stop-and-frisk rate. This controversial NYPD policy allowed officers to stop, interrogate and search people solely on the basis “reasonable suspicion.” The NYPD’s stop-and-frisk practice was eventually ruled unconstitutional after it was shown that of the more than 5 million stops conducted under stop-and-frisk, the overwhelming majority of involved young Black and Latino men. Like stop-and-frisk, the imprecise and discretionary nature of pandemic policing enabled over policing of marginalized communities, this time under the guise of public health protection.

These findings underscore the need to identify alternative strategies for promoting public health goals that do not rely on policing and arrest, even beyond the context of the COVID-19 pandemic. Using policing as a tool for social service provision or public health promotion in any context risks perpetuating racialized criminalization and exacerbating racialized health inequities.

Posted in COVID-19, Ethnicity, Health Disparities, Mass Incarceration, Neighborhood Environments, Pandemic, Race, Racism, Social Environments, Spatial Analysis, Urban Health | Leave a comment

The COVID-19 Pandemic as a Threat Multiplier for Childhood Health Disparities: Evidence from St. Louis, MO

In the United States, the COVID-19 pandemic has highlighted and exacerbated socioeconomic and racial health disparities. For example, U.S.-based studies have found that the mortality rates for Black, Hispanic, Latino, and Indigenous communities from COVID-19 are double that of their White counterparts. Additionally, the pandemic is believed to have also exacerbated educational inequities for children as poorly funded school districts could not adapt and transition to remote learning as promptly as higher funded school districts. 


In research recently published in the Journal of Urban Health, doctoral student Nadav Sprague and colleagues examined the impact of the COVID-19 pandemic on health behavior outcomes among St. Louis Public Schools District (SLPS) students. The study findings suggested that the COVID-19 pandemic may be a threat multiplier for childhood health disparities. Briefly, a threat multiplier is an extreme event of change (in this study, the COVID-19 pandemic) that aggravates stress factors in specific clusters of a population with high pre-existing stress factors. In this study, Black children and children from single-adult households were more likely to see increases in stress factors than their counterparts.  


Sprague and colleagues collected data from parents picking up free lunches and learning material for their children from 27 October to 10 December 2020. The 29-item questionnaire was adapted from the National Institute of Health’s Environmental Influences on Child Health Outcomes Cohort (ECHO) COVID-19 Questionnaire. The questionnaire included questions on demographics and how the COVID-19 pandemic impacted the child (such as whether the child had been diagnosed with COVID-19 and how the pandemic altered the child’s health behaviors). Sprague and colleagues used K-means cluster analyses to identify distinct health behavior cluster profiles. The authors identified two distinct cluster profiles: a High Impact profile (n = 49) and a Moderate Impact profile (n = 73). Children in the High Impact cluster had a greater risk of being diagnosed with COVID-19, developed worsened eating habits, spent less time sleeping, and spent less time outdoors than those in the Moderate Impact cluster. The High Impact cluster was more likely to include Black children and children from single-adult households than the Moderate Impact cluster. The findings from this study provide valuable information that can inform interventions to help mitigate the effects of the COVID-19 pandemic and help reduce the burdens of future threat multipliers (such as climate change).

Posted in Childhood Adversity, COVID-19, Pandemic, Race, Stress, Urban Health | Leave a comment

Lessons Learned From Dear Pandemic, a Social Media–Based Science Communication Project Targeting the COVID-19 Infodemic

The World Health Organization (WHO) has identified excessive COVID-19-related information as a public health crisis, calling it an “infodemic.” The infodemic has been exacerbated by uncertainties inherent in an emerging infectious disease and the scientific process more generally. Together with inconsistent governmental messaging, these factors have led to challenges in delivering accurate, timely, and trusted information to the public.

In a manuscript recently published in Public Health Reports, Dr. Sandra Albrecht and colleagues present the origins, aims, and lessons learned from Dear Pandemic, a multidisciplinary, social media–based COVID-19 science communication project. The project aligns with the WHO’s call for scientists to engage in infodemic management to help ensure the public has access to timely and accurate information that is easily understood.

Dear Pandemic was created in March 2020 after the founders, public health researchers, became inundated with queries about COVID-19 from family and friends. They created Dear Pandemic on social media to consolidate their communication efforts in a public forum. Coming up on the  2-year anniversary of its launch, the project has a combined monthly reach of more than 4 million unique views across 3 social media platforms (Facebook, Instagram, and Twitter), an email newsletter, and a website, with coverage throughout the US and more than 60 countries around the world. Content is adapted for each social media platform to maximize readability and visibility. A subset of posts is translated and adapted into Spanish for Querida Pandemia, the Spanish-language page on Facebook. The project’s goals are to: (1) disseminate trustworthy, comprehensive, and timely scientific content about the pandemic and other health topics to lay audiences and (2) promote media and science literacy, equipping readers to better manage health-related infodemics within their own networks.

Based on practical experience, Dear Pandemic evolved to operate under a set of guiding principles that inform content and interactions with readers. These include: (1) the application of a risk reduction model framework and a (2) two-way model of communication. Posts on Dear Pandemic provide a framework for thinking about risk mitigation as a continuum and encourage readers to apply the framework to their own lives (see Figure as an example). Consistent with a harm reduction approach, this strategy aims to reduce the harms associated with certain behaviors, particularly when the restriction of behaviors is unrealistic over the long term. Also critical to Dear Pandemic’s success is a two-way model of communication. This framework calls upon experts to approach the audience as partners in conversation. This differs from the one-way didactic framework customary in most public health communication strategies.

Dear Pandemic has emerged as an example of a promising new paradigm for public health communication to bridge the chasm between the scientific community and the practical decision-making needs of the public. The project provides a roadmap for other scientists (and public health agencies) interested in using social media as an outreach tool, and serves as a unique case study informing future efforts to combat health misinformation.

Posted in Uncategorized | Leave a comment

Ridesharing is Associated with Assaults around Bars in NYC

Ridesharing companies such as Uber and Lyft have completed more than 20 billion rides globally since 2010. Studies have found that this change to transportation systems has affected health outcomes, including alcohol consumption and motor vehicle crashes. In research recently published in Drug and Alcohol Dependence, doctoral student Christina Mehranbod and colleagues explored the effects of ridesharing on alcohol-related assaults in New York City. Using a novel spatial ecological case-crossover study design, the authors found ridesharing was associated with an increased incidence of nighttime assaults at bars.

Using publicly available data from the NYPD and NYC Taxi and Limousine Commission (NYC TLC), the authors were able to geolocate assault events in the 262 taxi zones, the spatial unit used by the NYC TLC, for 2017-2018. The spatial ecological case crossover study allowed the researchers to compare taxi zone-hours where a nighttime assault occurred at a bar or restaurant — case taxi zone-hours — to taxi zone-hours one week before and one week after the case taxi zone-hour — control taxi zone-hours. This study design controls for those environmental conditions such as overall foot traffic, bars or restaurant size, and more, that would regularly influence the availability of ridesharing services and risk of nighttime assault at any on-premise alcohol outlet.

Mehranbod and colleagues found that for every 100-trip increase in the number of rideshare trips, there was a 5% increase in the number of nighttime assaults at a bar. The authors did not find the same significantly positive association at restaurants. With existing evidence pointing to increases in alcohol consumption associated with ridesharing, the findings that ridesharing may also increase nighttime assaults at bars adds to our understanding of ridesharing’s impact on population health, especially in metropolitan areas.

Posted in Alcohol, Alcohol Consumption, Spatial Analysis, Urban Health, Violence | Leave a comment

Maintaining patient privacy while geocoding patient addresses: Do Not Use R to Geocode!

Imagine if a clinical researcher were to disclose a list of patient addresses to a third-party – government agency, for profit company or not-for-profit entity – that was outside of their hospital or health system. Imagine the researcher then publicly announced they disclosed the addresses to the third party, that the addresses belonged to patients with a specific disease, and that those patients were being treated at a specific hospital. The researcher’s Institutional Review Board (IRB) and Health Insurance Portability and Accountability Act (HIPAA) compliance office would be outraged at these violations of patient privacy. Yet this sequence of events can happen inadvertently when studying how neighborhood conditions such as access to medical facilities or neighborhood food environments affect clinical outcomes in specific patient populations. A quick search of Google Scholar shows many articles that, through this sequence of events, have disclosed patient health data.

In a recent pre-press publication Rundle and colleagues show how geocoding patient or study subject addresses using a variety of R packages, STATA, SAS and QGIS can set of a cascade of events that discloses Personal Identifying Information (PII) and Protected Heath Information (PHI) in violation of usual IRB and HIPAA rules. We also show the flaws in several approaches proposed to protect PII and PHI in neighborhood health effects research and propose best practices to protect patient and study subject confidentiality in studies on neighborhood health effects.

Posted in Info-Graphix, Methods, Privacy | Leave a comment

The politics of depression: Associations between political beliefs and adolescent mental health

In a manuscript recently published in SSM Mental Health, Catherine Gimbrone and colleagues investigated the role that political beliefs play in shaping adolescent psychological wellbeing.

After decades of relative stability, adolescent mental health has sharply declined over the past decade, particularly among girls. Researchers have been unable to identify the causes of these trends, resulting in a growing mental health crisis among adolescents. Recent studies have focused on digital engagement and screen time as potential causes, but findings have been mixed. Another potential cause that had not been examined empirically, however, was adolescents’ political beliefs.

During this period of increasing mental distress, adolescents endured a series of significant political events. Those who grew up during the digital technology age have also been more attuned to political events than prior generations, likely due to ubiquitous and rapid access to online news sources. Importantly, political beliefs are related to mental health among adults, such that conservatives often fare better than liberals. They hypothesized that political beliefs, which encapsulate many aspects of lived experiences and social identity, might inform mental health trends among adolescents as well and that outcomes might differ by sociodemographic groups.

In both descriptive and regression analyses, they used cross-sectional self-report survey data from Monitoring the Future which included large, nationally-representative samples of US 12th-graders from 2005 to 2018. Primary analyses highlighted those who identified as liberal or conservative because these group are most prevalent in the US. They assessed four internalizing symptoms scales, including depressive affect, self-esteem, self-derogation, and loneliness, which are indicators of mood and anxiety disorders. Using linear regression, they analyzed moderation of time trends by political beliefs, sex, and parental educational attainment while also controlling for factors including race, religiosity, and geographic region.

They found that trends in internalizing symptoms among 12th-grade students diverged by political beliefs such that, while internalizing symptom scores worsened over time for all adolescents, they deteriorated most quickly for female liberal adolescents. Beginning in approximately 2010, female liberal adolescents reported the largest changes in internalizing symptoms (b for interaction ​= ​0.17, 95% CI: 0.01, 0.32), in contrast with male conservative adolescents who reported the smallest corresponding changes. Further, female liberal adolescents without a parent with a college degree reported the worst internalizing symptom scores compared to all other subgroups.

 Linear regression predicted mean main effects of political beliefs on depressive affect and self-esteem by sex and parental education: Conservative and liberal 12th-graders from 2005 to 2018.

Depressive affect

Self-esteem

≥ parental college degree indicates that at least one parent had a college degree. Linear regression predictions graphed. All models were adjusted for geographic region, urbanicity, race/ethnicity, and GPA.

Their findings indicate that specific groups of adolescents, such as those identifying as female and liberal, are at a heightened risk of experiencing worsening internalizing symptoms over time. It is therefore possible that the ideological lenses through which adolescents view the political climate differentially affect their mental wellbeing. Research into the construct of adolescent political identity, the political content adolescents consume, and subsequent effects on their mental health is recommended by the researchers, especially during the highly politicized COVID-19 pandemic.


Posted in Depression, Gender, Health Disparities, Mental Health, Socioeconomic Status | Leave a comment

The impact of COVID-19 lockdowns on population mental health: An analysis of GPS and Google search volume data

Catherine Gimbrone and colleagues recently published a paper in the journal PLoS One exploring the effects of COVID-19 lockdowns on population mental health. Using novel data sources that allow for near-real-time analysis of population behavior and thought, they found that increasing economic, mental health and suicide-related concerns coincided with COVID-19 related mobility restrictions in the US.

Throughout the pandemic, Americans have experienced elevated rates of financial and psychological distress that may result in increased suicide rates. The pandemic’s impact on suicide rates, however, remains unclear, with reported associations differing by time, place, and demographics.

Researchers have encountered several limitations in estimating the real-time effects of the pandemic on population mental health, especially given extensive delays in traditional data sources. Accurate assessment of the psychological impacts of lockdowns also requires a fluid measure of population behavior over time rather than imprecise proxies such as policy enactment dates. Further, trends in national mental health and economic concerns may obscure regional differences in pandemic experiences, such as for New York City (NYC) which became the global epicenter of the pandemic in the spring of 2020.

They sought to address these limitations by using time series analyses to estimate associations between the extent to which people were staying at home and indicators of economic, mental health, and suicide-related concerns derived from Google Health Trends search volumes, both nationally and in NYC from January 2020 through January 2021. Measures of the extent to which people were staying at home, referred to as mobility indicators, were aggregated from daily location data from millions of cell phones provided by the company SafeGraph. The two mobility indicators used in the study were the median time (in minutes) mobile devices were at home on a given day and the proportion of devices in a given area that did not leave their home on a given day.

They found that mobility indicators and economic stressor search volumes spiked both nationally and in NYC during the first wave of the pandemic in the spring of 2020. Fluctuations for other mental health and suicide-related term categories were minor in comparison.

Proportion of devices completely at home and economic stressor search volumes nationally and in the NYC Designated Market Area (DMA)

The researchers then employed transfer function models to assess relationships between time series for mobility indicators and search volumes. Their methods included a process termed prewhitening which guards against spurious correlations and permits assessment of the impact of the explanatory time series, mobility indicators, on the dependent time series, search volumes, such that changes in the dependent time series may be attributable to changes in the explanatory time series and vice versa.

They calculated correlations between the residuals of prewhitened explanatory and dependent time series at multiple weekly lags. A cross-correlation coefficient (CC) at a negative weekly lag, say 10, indicates that changes in the explanatory time series, mobility indicators, predicted changes in the dependent time series, search volumes, 10 weeks later. A CC at a positive weekly lag, however, indicates that changes in the dependent time series instead predated changes in the explanatory time series. A CC at a 0-week lag suggests that changes in both time series were concurrent.

The largest CC across analyses, 0.6, occurred nationally between the mobility indicator proportion of devices that did not leave home and searches for economic stressor terms at a 0-week lag. Additionally, larger positive CC for economic stressor terms were found across locations and mobility indicators at negative and 0-week lags, demonstrating that as mobility restrictions increased, search volumes for economic stressor terms increased both concurrently and in the following weeks.

Heatmaps of cross-correlation coefficients for proportion of devices completely at home and economic stressor search volumes nationally and in the NYC DMA

Trends for mental health and suicide-related search term categories, however, diverged by location and mobility indicator. National associations were stronger and more consistent, showing a series of medium to large positive CC at a 0-week lag for the mobility indicator median time devices spent at home. Within the NYC DMA, however, there were few discernable patterns in CC across mobility indicators.

Heatmaps of cross-correlation coefficients for time at home and mental health and suicide-related search volumes nationally

In summary, the researchers found that pandemic mobility restrictions were contemporaneously linked to trajectories of online searches for terms related to economic distress across locations and that positive associations emerged nationally between declining mobility and mental health and suicide-related search volumes during the pandemic.

These results underscore the pervasiveness of pandemic-induced economic hardship and encourage further consideration of the relationships between isolation and mental health and suicide risk. They also contribute to a growing body of research on the utility and validity of Google Trends data to monitor population mental health.

Posted in Anxiety, COVID-19, Depression, Economic, Stress | Leave a comment

Rideshare Trips and Alcohol-Involved Motor Vehicle Crashes in Chicago

Morrison and colleagues recently published a paper reporting on a case-case analysis of rideshare activity near alcohol-involved and non-alcohol-involved car crashes in Chicago.  The observed higher level of rideshare activity near crashes that did not involve alcohol suggests that ridesharing may replace motor vehicle trips by alcohol-impaired drivers.

The alcohol-involved car cases were 962 crashes that the police report indicated were alcohol involved, which were compared to 962 1-to-1 matched crashes reported not to involve alcohol, that occurred in the same Census tract as the alcohol-involved crash.  Morrison and colleagues tested whether the density per square mile of rideshare trips (Lyft and Uber) that were in progress nearby, at the time of the crash, predicted car crash type.  Rideshare trips underway at the time of the crash were calculated using data on trip start and stop times and locations reported to the City of Chicago by the ride share companies.  Trip routes were estimated using the shortest drive distance between the start and stop location.

Mean rideshare trip density was 69.0 per square mile (SD = 129.7) at the time and location of alcohol-involved crashes and 105.7 per square mile (SD = 192.6) at the time and location of non-alcohol-involved crashes. After controlling for covariates, it was found that a standard deviation increase in rideshare trips per square mile at the crash location was associated with 23% decreased odds that the crash was alcohol involved (95% confidence interval 0.594, 0.878).  These results suggest that ridesharing may replace motor vehicle trips by alcohol-impaired drivers.

Estimated route path and kernel density layer for rideshare trips that were active at the time of one crash. Crash location denoted by the red star. Raster value interpreted as density of active rideshare trips per square mile at the time of the crash.

Posted in Alcohol, Alcohol Consumption, Injury, Spatial Analysis | Leave a comment