@DearPandemic: a COVID-19-related scientific communication effort for the public

Epidemiologists and other scientists have become an important source of information for the public amid so much misinformation around COVID-19. “Dear Pandemic” is a public service effort by Dr. Sandra Albrecht, Assistant Professor of Epidemiology, in conjunction with an all-female team of 10 PhD-trained public health scientists/faculty from various institutions in the US and the UK, with expertise ranging across epidemiology, demography, nursing, health policy, and mental health clinical practice, among others. Together, they interpret the latest scientific findings, respond to queries from the public, and dispel myths around the virus via their “Dear Pandemic” social media profiles on Facebook, Instagram, and Twitter (@DearPandemic).  The team comes from different walks of life, so their collective networks exhibit broad geographic, political, cultural, and racial/ethnic diversity. Originally intended as a side project to deliver science-informed content to family, friends, and neighbors, this effort has grown into a large scientific communication effort with international reach that aims to educate and amplify facts and science for the public (see this JAMA Network article which calls for such efforts: https://jamanetwork.com/channels/health-forum/fullarticle/2764847).

Follow @DearPandemic and share with family and friends:

Facebook: https://www.facebook.com/dearpandemic/

Twitter: https://twitter.com/DearPandemic

Instagram: https://www.instagram.com/dear_pandemic/

Posted in COVID-19, Pandemic, Teaching Tools | Leave a comment

Severe COVID-19 Projections: Data Visualization Tool

An online data visualization tool has just been released that allows users to explore the COVID-19 projections being released weekly by Jeff Shaman’s lab at the Columbia University Mailman School of Public Health.  These data have been powering Columbia’s interactive online mapping tool that shows projected numbers for severe COVID-19 disease compared to the supply of available critical care beds under a variety of scenarios.  The new data visualization tool allows users to see daily projected estimates of new cases, newly infected individuals and available critical care beds under a variety of scenarios for states and counties in the U.S.  The methods used to make these estimates are described here.

Data visualization of daily COVID-19 cases and available hospital critical care beds.

This data visualization tool was created by Tonguc Yaman, a doctoral student in the Department of Epidemiology, using Shiny R Server.


Posted in COVID-19, Health Disparities, Neighborhood Environments | Leave a comment

Mapping Food Insecurity During the COVID-19 Pandemic

Prior to the COVID-19 pandemic, 11% of households and nearly 16% of families with children were food insecure. With schools closed and families out of work, food insecurity rates are expected to skyrocket in the coming months. During the crisis, food store shelves have frequently been empty due to bulk purchasing and an increase in at-home meal consumption. In an effort to ensure food is available for SNAP shoppers when they receive their monthly benefits, social media campaigns have encouraged non-SNAP shoppers to avoid food shopping during SNAP distribution dates. This is a particular concern in counties with large SNAP populations and in states with only a few SNAP distribution days per month (e.g., Nevada, Virginia, New Jersey). To inform these efforts, Dr. Eliza Kinsey, a post-doctoral researcher with the Social and Spatial Epi Unit, developed a web mapping tool of SNAP distribution schedules and participation rates by county. This tool is intended to be used, both by household food shoppers and by policy-makers in designing strategic efforts to combat the food insecurity and nutrition challenges brought on by the COVID-19 crisis.

The maps use current SNAP schedule distribution information and 2018 participation counts. Dr. Kinsey plans to update the mapping tool regularly with pertinent SNAP participation changes and unemployment data.

Food insecurity in America

Posted in Food Insecurity, Health Disparities, Info-Graphix, Mapping, Pandemic, Socioeconomic Status, Spatial Analysis | Leave a comment

Updated: County Level Estimates of Highly Stressed Health Care Systems

The Built Environmental and Health Research Group’s online mapping tool has been updated with new data showing counties that are at high risk of experiencing patient volumes that exceed their hospital capacity over the next 6 weeks.  The maps show at risk counties for three different levels of social distancing and two levels of intensity of surge responses by hospitals.  The estimates use Jeffrey Shaman and colleague’s models of disease spread and the estimates posted previously of how many critical care hospital beds can be made available under various assumptions of hospital responses to patient surges. A full description of the methods can be found |here|

As in prior posts, the mapping site is a work in progress and will be updated frequently.


Posted in COVID-19, Health Care, Health Disparities, Mapping, Spatial Analysis | Leave a comment

COVID-19 and Food Insecurity

Mailman School researchers are calling attention to the way in which COVID-19 is magnifying food insecurity in the U.S. and the link between food insecurity and long term health effects among children. The rapid spread of COVID-19 throughout the United States has led to statewide stay-at-home orders and school closures for the vast majority of the country. The National School Lunch Program, School Breakfast Program and Child and Adult Care Food Program serve a combined 35 million children daily, providing vital nutrition and financial assistance to low-income families. For many children across the country, schools and childcare centers are an essential source of nutrition, providing as much as two thirds of a child’s daily food intake. Projections in Philadelphia by Dr. Eliza Kinsey, a postdoctoral researcher in the Epidemiology Department, demonstrate that even a 3-day school closure could result in more than 400,000 missed meals among school-aged children. Dr. Kinsey has been invited to participate in the CDC’s COVID-19 Food Insecurity Working Group to help create national estimates of missed meals among children resulting from COVID-19 related school closures.

Prior to the COVID-19 pandemic, nearly 16% of families with children were food insecure. With schools closed and families out of work, food insecurity rates are expected to skyrocket in the coming months. Even short term food insecurity can have significant impacts on children’s health, including poorer behavioral, emotional and nutritional outcomes. Among children, food insecurity has been linked to increased risk of weight gain and obesity, which can have long-term consequences for chronic disease morbidity.

Food Pantry Shelves

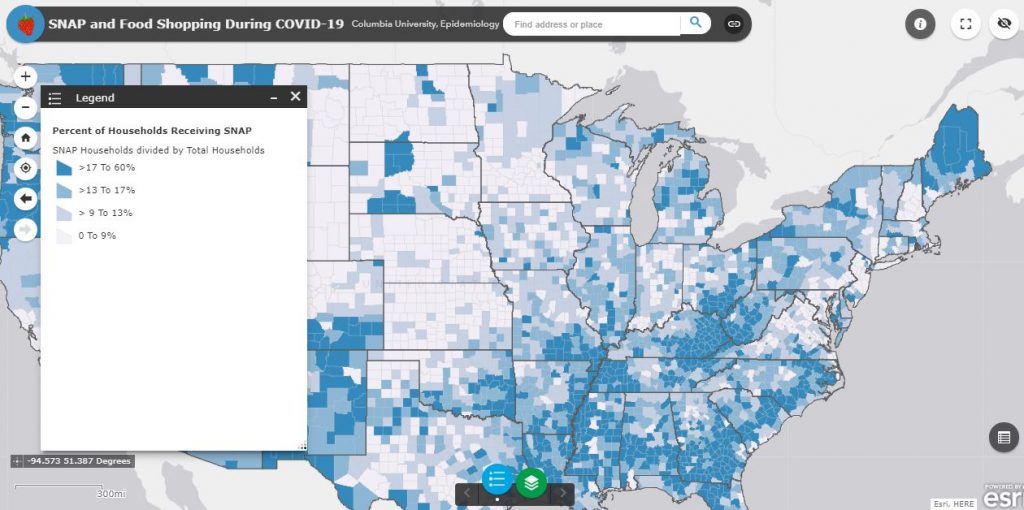
Not only will household food insecurity spike due to loss of employment and school closures, social distancing practices will make it harder for low-income families to use common food insecurity coping strategies, such as eating at soup kitchens and sharing food with friends and family. Furthermore, shielding behaviors often employed by parents to ensure their children eat even in times of uncertain food access could result in a domino effect of health and nutritional implications for families. Lastly, food hording, as has been widely documented across the country, leaves low-income families who cannot afford to buy in bulk quantities at an extreme disadvantage when they find empty shelves at grocery stores. For families who rely on SNAP and WIC, this is even more worrisome as their food shopping is already restricted to stores that accept the benefits and stock the approved food items. SNAP households typically run out of benefits before receiving their next disbursement, which constrains the timing of food shopping trips.

In response to the rapid uptick in food insecurity across the country, Congress’ $100 billion Families First Coronavirus Act relief measure made a number of provisions to expand federal nutrition assistance programs. One key provision enables states to issue meal-replacement benefits through the Supplemental Nutrition Assistance Program (SNAP) for households with children receiving free or reduced-price meals, which would amount to a SNAP dollar value of roughly $114 per child a month. Local educational authorities are also enabled to use feeding practices from the USDA’s summer meals programs to ensure children receive adequate nutrition during school closures. However, as Dunn et al. observed in their recent New England Journal of Medicine perspective, federal guidelines on how to execute feeding programs safely and effectively amidst the COVID-19 outbreak are lacking and many school districts do not have experience with the summer feeding programs.

Additionally, work requirements for SNAP have been waived and states are allowed to increase SNAP allotments up to the maximum benefit amount as an emergency measure. However, at this time, states are not allowed to increase SNAP benefits for families already receiving the maximum benefit, which includes 2.5 million households with children. Federal guidance to address the current food insecurity crisis is critical for ensuring adequate nutrition and long-term health outcomes for millions of low-income children.

As local authorities await federal guidelines, many have implemented creative strategies of their own. Some school districts have begun delivering meals to students via school busses driving along their regular routes. Other cities and states, including Philadelphia and South Carolina are implementing grab-and-go food pick-up sites where families can obtain 5 days of food at one time. In an attempt to provide a more centralized, efficient response to food insecurity, New York City has named a Food Czar to oversee all response efforts in the city during the COVID-19 crisis. Despite innovative strategies to alleviate the impact of this crisis on the food security of children and families, the COVID-19 pandemic will exacerbate health disparities and have profound effects on the food and financial security of many in this country for years to come.

Dr. Kinsey will be leading research efforts to understand, and plan for, the clinical and public health effects of increased childhood food insecurity that is resulting from the COVID-19 pandemic.  Dr. Kinsey was recently awarded a career development award by the Eunice Kennedy Shriver National Institute for Child Health and Human Development of the National Institutes of Health (K99HD101657) to study the impact of early life food insecurity exposure on child weight gain and cognitive development trajectories. She will lead analyses in the Columbia Children’s Center for Environmental Health birth cohorts to examine the effects of food insecurity over the life-course.

Posted in COVID-19, Food Insecurity, Pandemic | Leave a comment

COVID-19 Related School Closings and Risk of Weight Gain Among Children.

Andrew Rundle and colleagues wrote a Perspective article for The Obesity Society’s journal Obesity, to call attention to the COVID-19 pandemic’s likely longer-term effect on children’s health. In many areas of the U.S., the COVID-19 pandemic has closed schools and some of these school systems are not expected to re-open this school year. COVID-19, through these school closures, may exacerbate the epidemic of childhood obesity and increase disparities in obesity risk.

From Kindergarten Through Second Grade, U.S. Children’s Obesity Prevalence Grows Only During Summer Vacations [von Hippel et al., 2016]

While much has been written about poor food and physical activity environments in schools, the data show that children experience unhealthily weight gain, not during the school year, but primarily during the summer months when they are out of school.  Von Hippel and colleagues have documented increases in student’s weight and the prevalence of obesity and overweight across three school years, with increases in obesity and overweight prevalence occurring only during summer recess.  Unhealthy weight gain over the summer school recess is particularly apparent for Hispanic and African American youth, and children already experiencing overweight. Importantly, the data show that the weight gained during the summer months is maintained during the school year and accrues summer to summer.  Furthermore, obesity experienced as young as age 5 has been shown to be associated with significantly higher BMI through to age 50 and higher fat mass at age 50.

The authors anticipate that the COVID-19 pandemic will likely double out-of-school time this year for many children in the U.S. and in addition will exacerbate the risk factors for weight gain associated with summer recess.  There is a dual food environment issue with the COVID-19 school closures: 1) school closures increase food insecurity for many families, which is linked to unhealthy weight in children; and 2) as households stock up on shelf-stable foods, they appear to be purchasing ultra-processed, calorie-dense comfort foods.   In regards to physical activity, social distancing and stay at home orders issued in cities across the globe reduce the opportunities for physical activity among children, particularly for children in urban areas living in small apartments.  Sedentary activities and screen time are expected to expand under social distancing orders; available data show that online video game usage is already soaring.  Screen time is associated with experiencing overweight/obesity in childhood, likely because of the dual issues of sedentary time and the association between screen time and snacking.

The authors discuss some possible interventions for reducing risk factors for unhealthy weight gain during the school closures.

Posted in Ethnicity, Health Disparities, Obesity, Physical Activity, Race | Leave a comment

County Level Estimates of When Hospital Capacity will be Overwhelmed

A multi-institution team led by Charles Branas, and including Andrew Rundle and staff from the Social and Spatial Epidemiology Unit, has been making county level estimates for the U.S. of the time until health systems are overwhelmed with patients.  The analyses use a 28 day look forward window from 3/24/2020 and identify numerous counties where the health care system is expected to be overwhelmed; 28-day look forward analyses will be re-done weekly. Projections of time to health care systems being overwhelmed have been made for various levels of social distancing and various levels of intensity of hospital response to patient surges.  A paper detailing all of the estimates will be uploaded to pre-press sites soon.

The Built Environmental and Health Research Group’s online mapping tool is currently displaying maps based on these analyses that show which counties are projected to experience patient volumes that exceed their hospital capacity over the next 28 days, under three scenarios: 1) no-social distancing and low intensity hospital response to patient surge; 2) no-social distancing and medium intensity hospital response to patient surge; and 3) no-social distancing and high intensity hospital response to patient surge.  The estimates use Jeffrey Shaman and colleague’s models of disease spread and the estimates posted previously of how many critical care hospital beds can be made available under various assumptions of hospital responses to patient surges.

As in prior posts, the mapping site is a work in progress and will be updated frequently.

Time to patient demand exceeding hospital capacity: 28 day look forward from 3/29/20, no social distancing and a medium surge response

Posted in Health Care, Health Disparities, Mapping | Leave a comment

Estimated ICU Beds Available to Respond to Patient Surges

Social and Spatial Epidemiology Unit members Charles Branas and Andrew Rundle, along with colleagues from Patient Insight, the Mount Sinai Health System and MIT, have created estimates of the number of hospital critical care beds, including ICU beds and other hospital beds used for critical care purposes, that could be made available by hospitals in response to patient surges.  Three scenarios of intensity of hospital response were created, taking into account existing ICU bed availability, currently occupied ICU beds that can be made available, other beds such as post-anesthesia care unit bed, operating room beds, and step-down beds that could be converted to critical care beds for COVID-19 patients and the possibility of having two patients use one ventilator in ICU. All civilian acute medical-surgical tertiary care hospitals and long-term acute care hospitals for which data were available in the US are included.

The data are mapped on the Built Environment and Health Research Group’s online interactive COVID-19 mapping tool.  The documentation of their methods is here.

Screen shot of the BEH COVID-19 mapping tool showing the distribution of COVID-19 cases (blue) and estimated available ICU beds under a Moderate Intensity Response to patient surges


Posted in Health Care, Health Disparities, Mapping, Spatial Analysis | Leave a comment

Mapping Populations at Risk for Severe COVID-19, continued

The Built Environment and Health Research Group’s geographer extraordinaire, James Quinn, built a new version of their interactive mapping tool for severe COVID-19.  The map depicts populations at high risk of severe COVID-19 due to older age or underlying health conditions, the availability of ICU beds and the ratios of  high risk populations to ICU beds.  The interactive mapping tool is here.  This is an ongoing project and they will keep updating the maps with new data and features as the pandemic continues.


Posted in Diabetes, Health Care, Health Disparities, Info-Graphix, Mapping, Spatial Analysis | Leave a comment

Documenting the Iron Pipeline: The flow of guns around America

On Saturday May 2, 2015, Detective 1st Grade Brian Moore of the New York Police Department was shot and killed in while on patrol in Hollis, Queens. Moore’s partner, Eric Jansen, was also shot but was not seriously injured. In the days after the shooting, it emerged that Moore’s killer used a weapon that had been stolen from a gun shop in Perry, Georgia, four years earlier. US Senator Chuck Schumer demanded a “federal crackdown” on illegal interstate gun transfers. Everytown for Gun Safety pointed to the trafficking routes that follow Interstate-95 as a clear culprit. President Barack Obama echoed these concerns. “Guns cross state lines as easily as cars do. If your state has strong gun laws but the neighboring state does not have strong gun laws, the guns come into your state. That’s called the Iron Pipeline.”

New research from Assistant Professor Christopher Morrison and collaborators from around the United States finds evidence that the Iron Pipeline is thriving. The researchers accessed data from the Bureau of Alcohol, Tobacco, Firearms and Explosives that identified the original retail location for all guns used in crimes in 2015-2017 in the contiguous United States. Combining these data from the Boston University State Firearm Laws database, Morrison and colleagues examined associations between the number of guns trafficked between pairs of states and the strength of gun laws at the origin and destination. They found that guns flowed from states with weak laws to states with strong laws, and in particular, from states with weaker buyer laws to states with stronger background check laws.

The figure below is a graph showing flow between all 48 included states. The size of the state node corresponds with the number of gun laws enacted in the states, the thickness of the link indicates the number of guns that flowed from the origin to the destination, and the direction of the flow is clockwise. The figure demonstrates, for example, that flow from Georgia to New York is heavier than flow from New York to Georgia, and that New York has many gun laws while Georgia has few gun laws.

It seems the concerns following Detective 1st Grade Moore’s shooting were well placed. The Iron Pipeline undermines strong state gun laws in New York and elsewhere across the extent of the United States.

The Iron Pipeline: the flow of guns around America

Posted in Injury, Mapping, Spatial Analysis | Leave a comment