Throwback Thursday posts will revisit previously published articles and provide results of additional analyses that didn’t fit within the Journal’s word limits or re-imagine how the underlying data in the paper can be presented graphically.
Following up on data from occupational studies, Rundle and colleagues have been investigating possible environmental causes of prostate cancer, documenting the presence and correlates of DNA damage from polycyclic aromatic hydrocarbons (PAH) in prostate tumor and tumor adjacent tissue from prostatectomy patients at the Henry Ford Health System, in Detroit. PAH are a family of environmental carcinogens resulting from incomplete combustion processes and are found, among other places, in air pollution, cigarette smoke, and diesel exhaust. PAH can damage DNA by covalently bonding to DNA bases forming what are known as PAH-DNA adducts.
A PAH-DNA adduct intercolated into a DNA double helix.
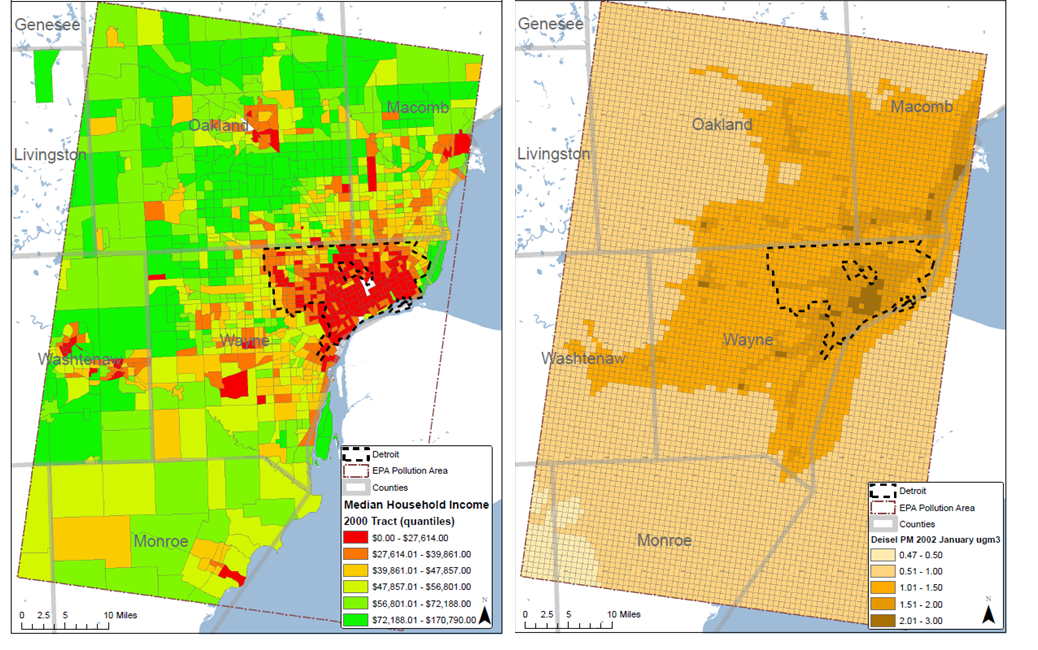
By 2012 they had documented associations between: PAH-DNA adduct levels and pathological features of prostate cancer, between adduct levels and genetic polymorphisms in genes coding for enzymes that metabolize PAH, and between adduct levels and biochemical recurrence after prostatectomy. However, a strong, overall relationship between PAH-DNA adduct levels in prostate tissues and cigarette smoking, a major source of PAH exposure, had not been observed. But as shown in the paper, when the men were grouped into those living in higher and lower income neighborhoods it was found that adduct levels varied by both smoking status and neighborhood circumstances.
The graph below shows the covariate adjusted mean (and 95% CI) PAH-DNA adduct levels by smoking status among men living in Census tracts with higher and lower median household incomes. Among men living in higher income tracts PAH-DNA adduct levels increased across the categories of never, ex-, and current-smoker. Among men living in lower income tracts, PAH-DNA adduct levels were high and did not vary by smoking status. Overall, men living in lower income tracts had adduct levels equivalent to those of current smokers living in higher income tracts. The analyses adjusted for the men’s own educational attainment as a measure of their individual socio-economic status. The work shows a cross-level interaction between neighborhood conditions and individual-level smoking status on a molecular marker.
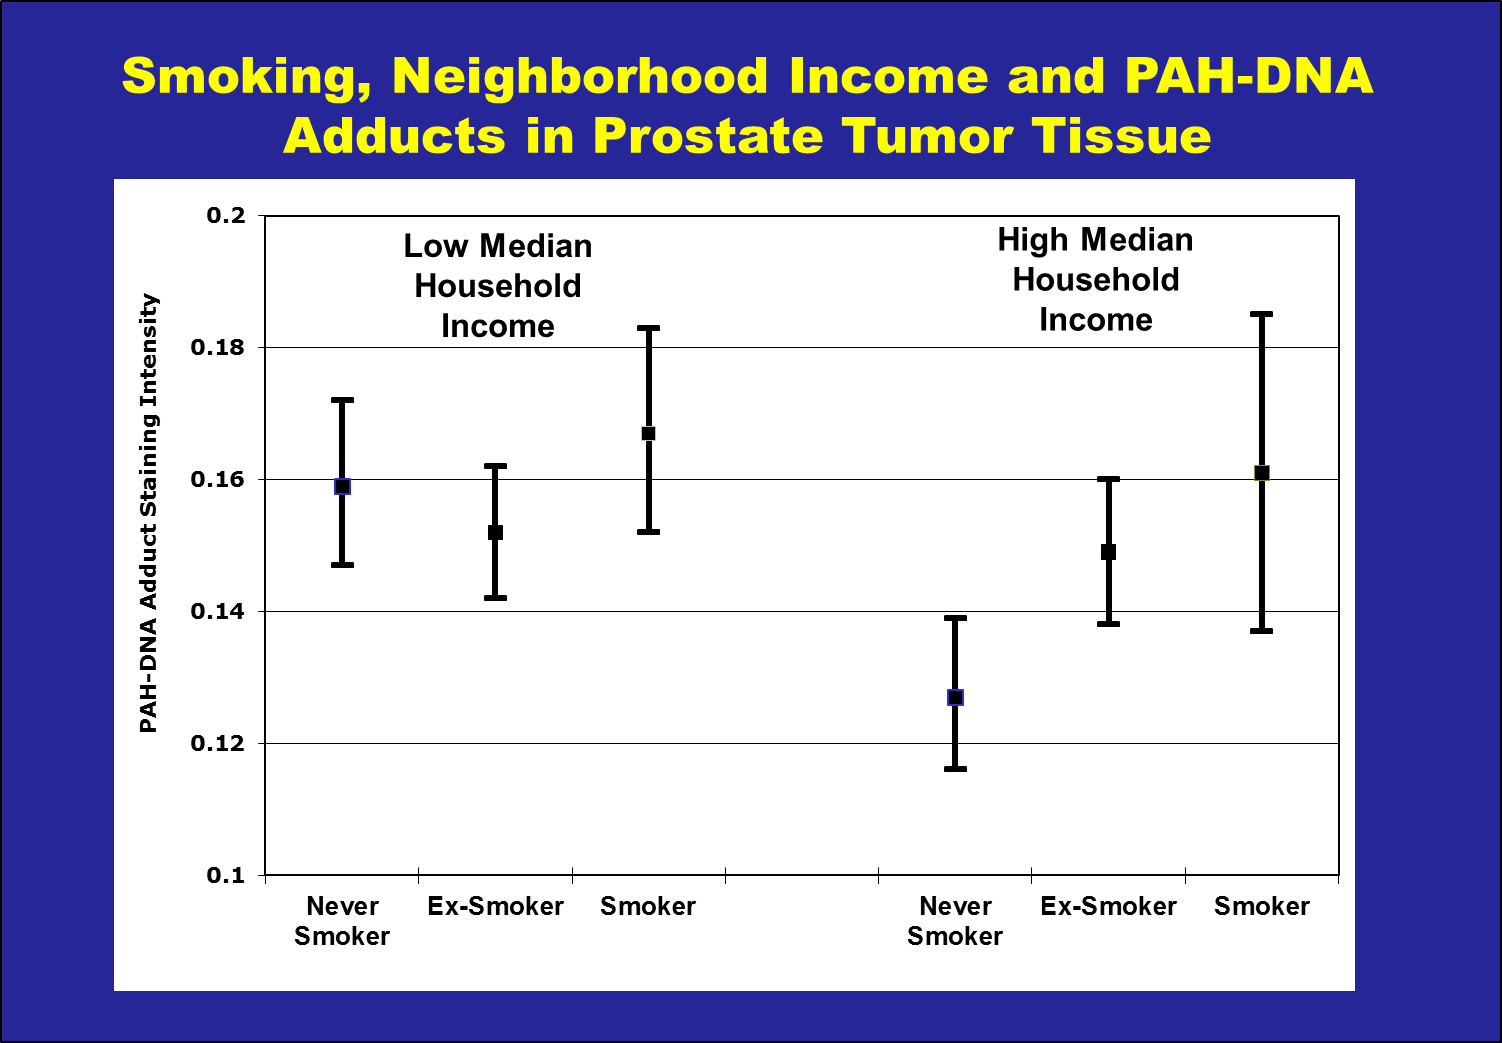
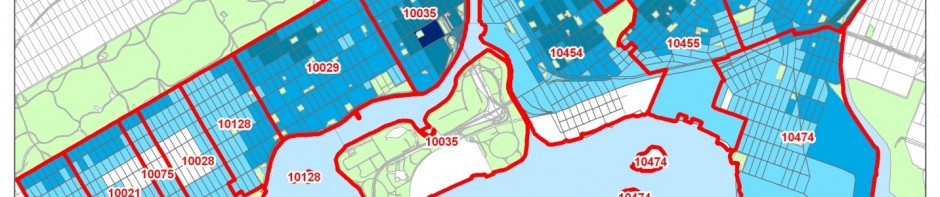
Census tracts were divided into low and high household income groups based on the median of the tract Median Household Income. PAH-DNA adducts were measured in prostate tissue using immunohistochemistry and the results of the assay are reported in Optical Density units.
 Andrew Rundle will be speaking at the


![Breakfast Club [1985]: clear risk preference shown by the flagrant disrespect for Mr. Vernon’s authority, not to mention drug use on school grounds and an illicit trip outside the library](http://blogs.cuit.columbia.edu/socialepicluster/files/2015/08/bfclub.png)