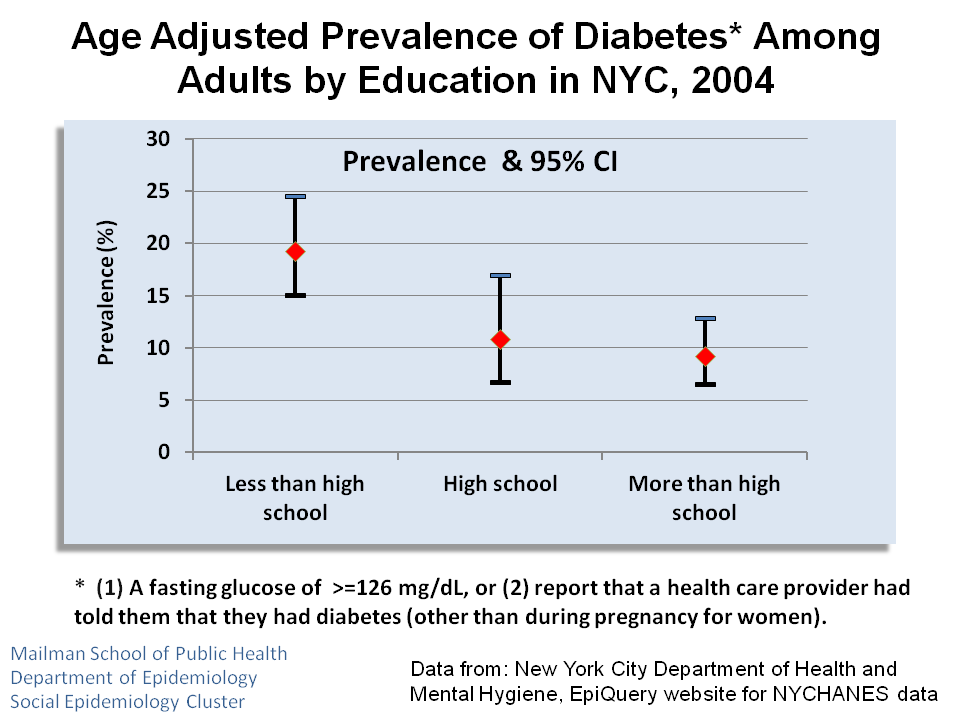
 We just posted the beginnings of a new slide deck that shows disparities in health conditions by education level among residents of New York City. The NYCHANES data were mined to plot the prevalence of Hypertension, Diabetes and Hyper-cholestriamia by level of education. The slides are available as PNG files and as a PowerPoint slide deck [HERE].