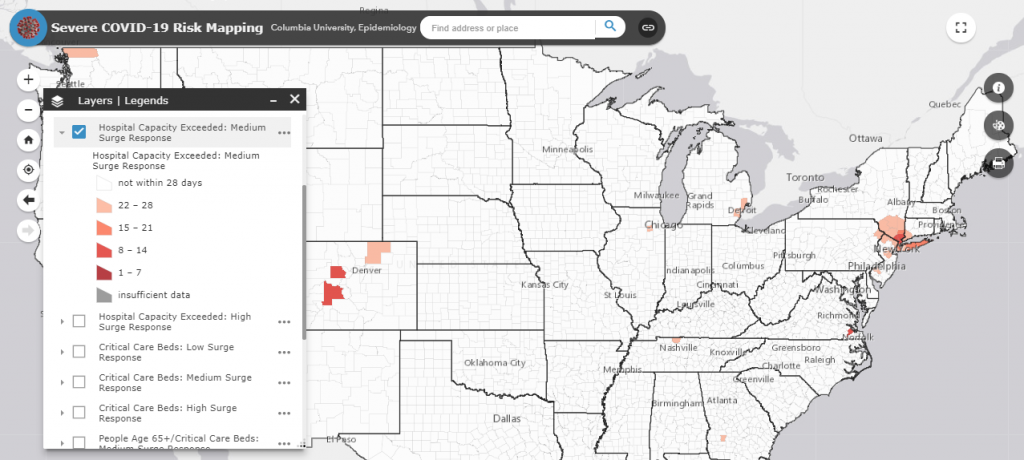
The Built Environmental and Health Research Group’s online mapping tool has been updated with new data showing counties that are at high risk of experiencing patient volumes that exceed their hospital capacity over the next 6 weeks. The maps show at risk counties for three different levels of social distancing and two levels of intensity of surge responses by hospitals. The estimates use Jeffrey Shaman and colleague’s models of disease spread and the estimates posted previously of how many critical care hospital beds can be made available under various assumptions of hospital responses to patient surges. A full description of the methods can be found |here|
As in prior posts, the mapping site is a work in progress and will be updated frequently.