
A multi-institution team led by Charles Branas, and including Andrew Rundle and staff from the Social and Spatial Epidemiology Unit, has been making county level estimates for the U.S. of the time until health systems are overwhelmed with patients. The analyses use a 28 day look forward window from 3/24/2020 and identify numerous counties where the health care system is expected to be overwhelmed; 28-day look forward analyses will be re-done weekly. Projections of time to health care systems being overwhelmed have been made for various levels of social distancing and various levels of intensity of hospital response to patient surges. A paper detailing all of the estimates will be uploaded to pre-press sites soon.
The Built Environmental and Health Research Group’s online mapping tool is currently displaying maps based on these analyses that show which counties are projected to experience patient volumes that exceed their hospital capacity over the next 28 days, under three scenarios: 1) no-social distancing and low intensity hospital response to patient surge; 2) no-social distancing and medium intensity hospital response to patient surge; and 3) no-social distancing and high intensity hospital response to patient surge. The estimates use Jeffrey Shaman and colleague’s models of disease spread and the estimates posted previously of how many critical care hospital beds can be made available under various assumptions of hospital responses to patient surges.
As in prior posts, the mapping site is a work in progress and will be updated frequently.
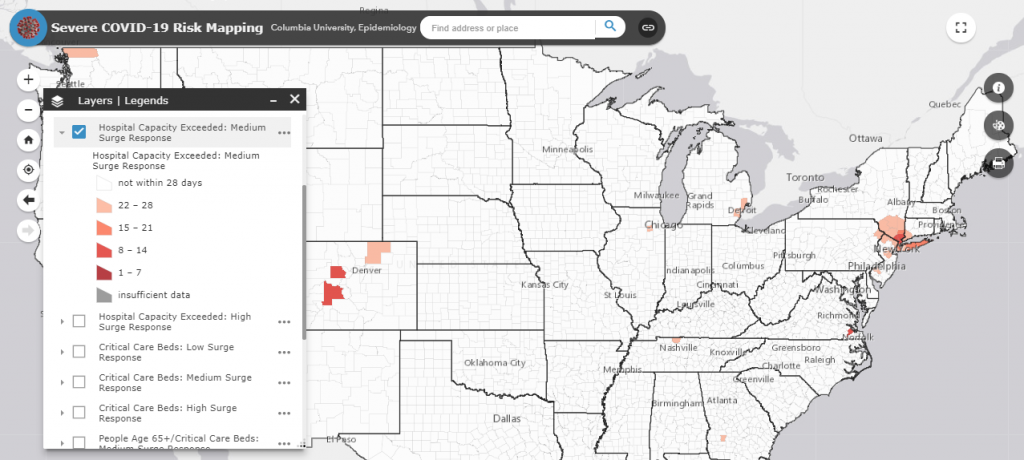
Time to patient demand exceeding hospital capacity: 28 day look forward from 3/29/20, no social distancing and a medium surge response