
Catherine Gimbrone and colleagues recently published a paper in the journal PLoS One exploring the effects of COVID-19 lockdowns on population mental health. Using novel data sources that allow for near-real-time analysis of population behavior and thought, they found that increasing economic, mental health and suicide-related concerns coincided with COVID-19 related mobility restrictions in the US.
Throughout the pandemic, Americans have experienced elevated rates of financial and psychological distress that may result in increased suicide rates. The pandemic’s impact on suicide rates, however, remains unclear, with reported associations differing by time, place, and demographics.
Researchers have encountered several limitations in estimating the real-time effects of the pandemic on population mental health, especially given extensive delays in traditional data sources. Accurate assessment of the psychological impacts of lockdowns also requires a fluid measure of population behavior over time rather than imprecise proxies such as policy enactment dates. Further, trends in national mental health and economic concerns may obscure regional differences in pandemic experiences, such as for New York City (NYC) which became the global epicenter of the pandemic in the spring of 2020.
They sought to address these limitations by using time series analyses to estimate associations between the extent to which people were staying at home and indicators of economic, mental health, and suicide-related concerns derived from Google Health Trends search volumes, both nationally and in NYC from January 2020 through January 2021. Measures of the extent to which people were staying at home, referred to as mobility indicators, were aggregated from daily location data from millions of cell phones provided by the company SafeGraph. The two mobility indicators used in the study were the median time (in minutes) mobile devices were at home on a given day and the proportion of devices in a given area that did not leave their home on a given day.
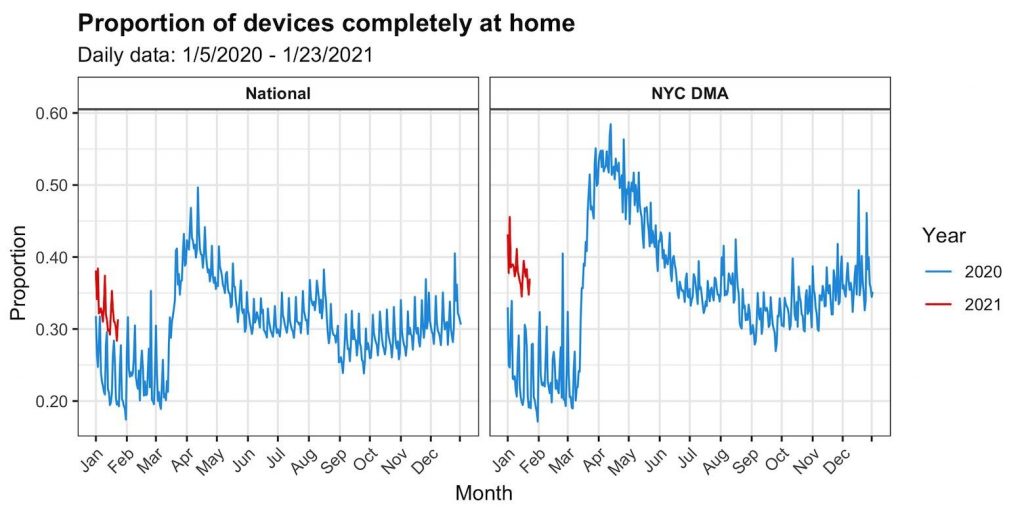
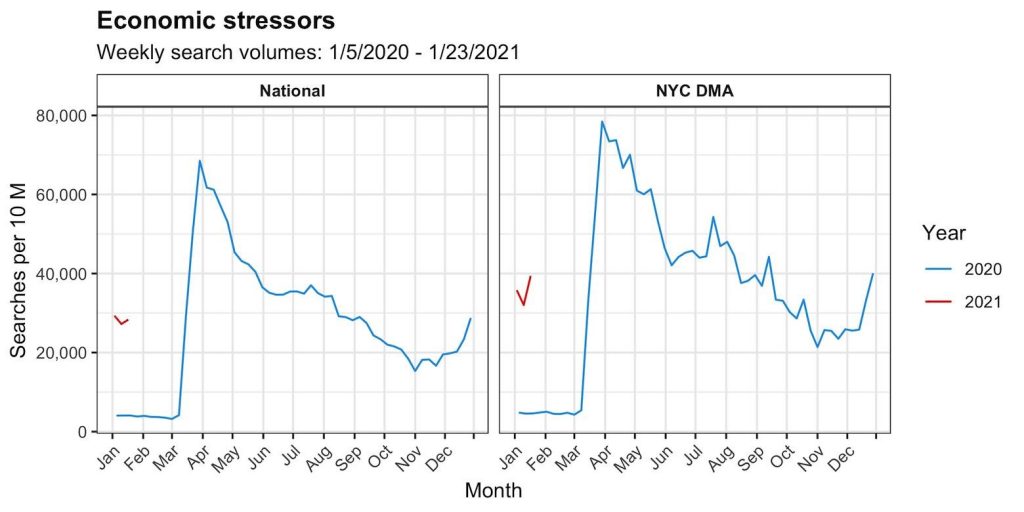
They found that mobility indicators and economic stressor search volumes spiked both nationally and in NYC during the first wave of the pandemic in the spring of 2020. Fluctuations for other mental health and suicide-related term categories were minor in comparison.
Proportion of devices completely at home and economic stressor search volumes nationally and in the NYC Designated Market Area (DMA)
The researchers then employed transfer function models to assess relationships between time series for mobility indicators and search volumes. Their methods included a process termed prewhitening which guards against spurious correlations and permits assessment of the impact of the explanatory time series, mobility indicators, on the dependent time series, search volumes, such that changes in the dependent time series may be attributable to changes in the explanatory time series and vice versa.
They calculated correlations between the residuals of prewhitened explanatory and dependent time series at multiple weekly lags. A cross-correlation coefficient (CC) at a negative weekly lag, say 10, indicates that changes in the explanatory time series, mobility indicators, predicted changes in the dependent time series, search volumes, 10 weeks later. A CC at a positive weekly lag, however, indicates that changes in the dependent time series instead predated changes in the explanatory time series. A CC at a 0-week lag suggests that changes in both time series were concurrent.
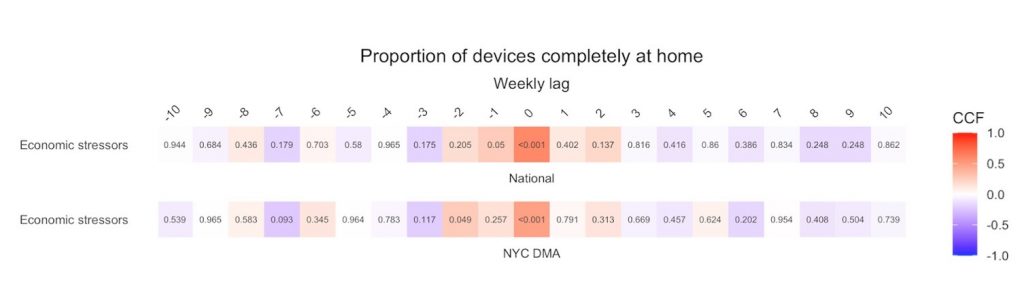
The largest CC across analyses, 0.6, occurred nationally between the mobility indicator proportion of devices that did not leave home and searches for economic stressor terms at a 0-week lag. Additionally, larger positive CC for economic stressor terms were found across locations and mobility indicators at negative and 0-week lags, demonstrating that as mobility restrictions increased, search volumes for economic stressor terms increased both concurrently and in the following weeks.
Heatmaps of cross-correlation coefficients for proportion of devices completely at home and economic stressor search volumes nationally and in the NYC DMA
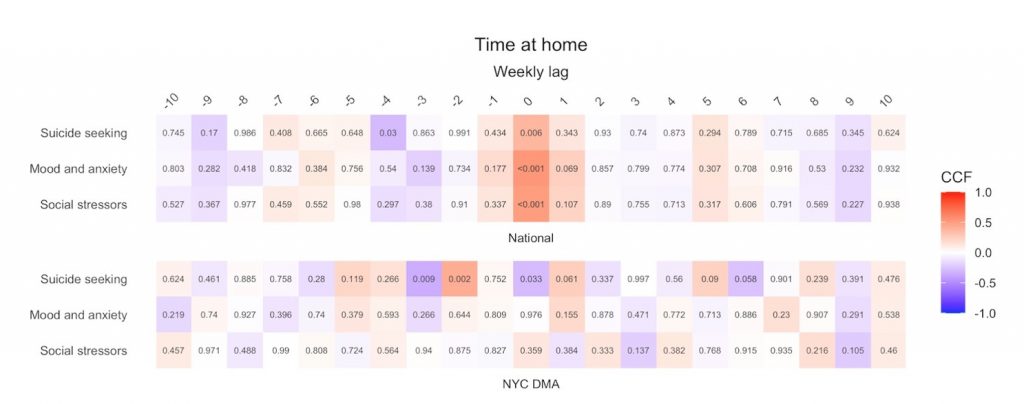
Trends for mental health and suicide-related search term categories, however, diverged by location and mobility indicator. National associations were stronger and more consistent, showing a series of medium to large positive CC at a 0-week lag for the mobility indicator median time devices spent at home. Within the NYC DMA, however, there were few discernable patterns in CC across mobility indicators.
Heatmaps of cross-correlation coefficients for time at home and mental health and suicide-related search volumes nationally
In summary, the researchers found that pandemic mobility restrictions were contemporaneously linked to trajectories of online searches for terms related to economic distress across locations and that positive associations emerged nationally between declining mobility and mental health and suicide-related search volumes during the pandemic.
These results underscore the pervasiveness of pandemic-induced economic hardship and encourage further consideration of the relationships between isolation and mental health and suicide risk. They also contribute to a growing body of research on the utility and validity of Google Trends data to monitor population mental health.