Social and Spatial Epidemiology Unit members, Byoungjun Kim, Andrew Rundle, Christopher Morrison, Charles Branas, and Dustin Duncan recently published research regarding neighborhood-level social and built environments as potential determinants of COVID-19 testing, case, and death rates in New York City.
There is emerging evidence that marginalized and vulnerable populations are disproportionately affected by COVID-19. In addition to the individual-level characteristics (i.e. age, race/ethnicity, and occupation), environmental factors in urban contexts such as urban design, housing density, and transportation systems can impact the transmission of infectious diseases. Recent analytic studies investigated the associations between neighborhood characteristics and the geographic distribution of COVID-19, but may have been susceptible to unstable population estimates in New York City. With the advent of COVID-19, the socio-demographic landscapes in New York City changed due to residents moving out of the city in response to the pandemic. However, the exodus from New York City was not uniform across neighborhoods, with greater migration occurring in higher income areas. The COVID-19 rates provided by New York City Department of Health and Mental Hygiene are based on estimated populations from census data before the pandemic, thus the SARS-CoV-2 testing and COVID-19 case/death rates are may be biased estimates. Kim et al examined the geographic variation in socio-demographic characteristics and built environmental factors in New York City in relation to COVID-19 testing, case and death rates and used cell phone data to estimate the variation in how many residents had left New York City across neighborhoods.
Kim et al. used COVID-19 statistics for testing, positive cases, and death counts of New York City residents by residential ZCTA (ZIP Code Tabulation Area) obtained from the New York City Department of Health and Mental Hygiene on June 10, 2020. In order to account for the residents moving out of the city during the COVID-19 pandemic, a dataset of cellular phone usage was utilized as a proxy measure of population changes. The data from cellular phone towers captures the mobility and migration patterns of a wide range of residents, as the towers interact with all types of cellular devices even when those devices are in stand-by and calls are not in progress. More than 1 million cellular devices that interacted with cellular towers in New York City were analyzed, and the percentage change in registered cellular phone signals between March 1, 2020 and May 1, 2020 were aggregated into census tracts by Teralytics Inc. Lastly, pre-pandemic socio-demographic characteristics were calculated by ZCTA from the 2018 American Community Survey 5-year estimates, including age, sex, race/ethnicity, median income, household size, occupation, and commuting characteristics.
The spatial regression model results showed that different sets of neighborhood characteristics were independently associated with COVID-19 testing, case, and death rates. For example, consistent with previous findings, the proportions of Black and Hispanic residents in a ZCTA were positively associated with COVID-19 case rates.
Contrary to the conventional hypothesis, neighborhoods with low-density housing experienced higher COVID-19 case rates. While this is not consistent with the conventional hypothesis (i.e. higher density as a risk factor of the infection), there are inconsistent findings regarding the association between population density and COVID-19 rates. Recent studies on neighborhood-level factors in Chinese and European cities reported that population density was negatively or not associated with COVID-19. One explanation could be the differential application of mitigation strategies. Early in the pandemic, the Center for Disease Control and Prevention announced guidelines for maintaining safe operations of multifamily housing, including closing public areas in the building, disinfecting common areas, providing hand sanitizer in common areas, and mandatory mask-wearing.
In addition, higher pre-pandemic transit ridership in a neighborhood was not associated with higher COVID-19 case or death rates. Subway use has decreased dramatically after the declaration of a local state of emergency, and this null association may reflect the reduced overall ridership during the pandemic.
Lastly, in regard to the demographic changes out-migration during the pandemic may bias the estimates of COVID-19 rates. News-media reported that out-migration varied strongly by neighborhood socio-demographic characteristics, and Kim and colleagues’ analysis found that neighborhood level out-migration was also associated with COVID-19 case rates.

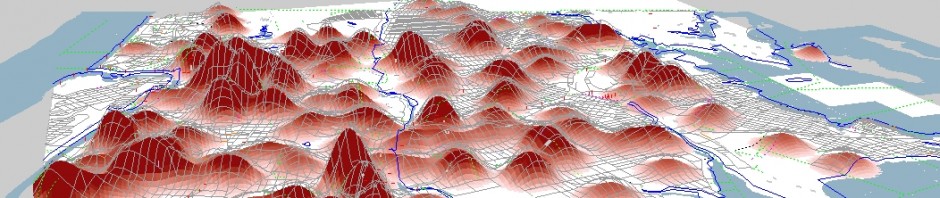
Figure 1. COVID-19 Testing, Case, Death Rates (/100,000) and Socio-demographics in New York City by ZCTA