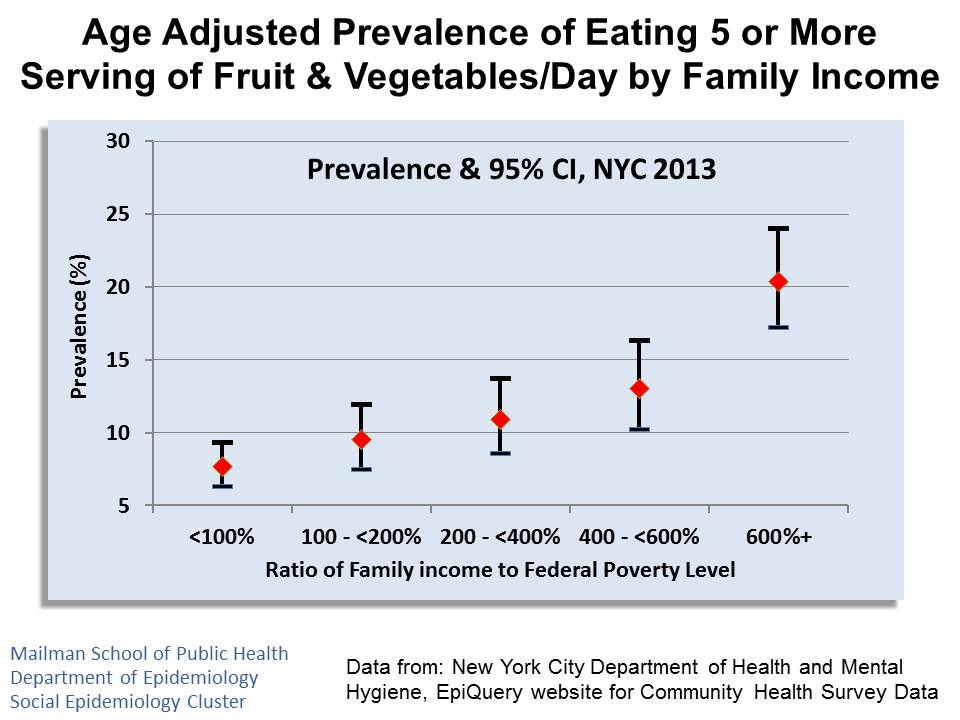
 We have been mining the NYC Department of Health and Mental Hygiene Community Health Survey data to create a series of info-graphic documenting disparities in health behaviors and conditions by race/ethnicity, educational attainment, income and neighborhood poverty rate. Thus far we have completed PowerPoint slide decks for Obesity Prevalence, Current Smoking, Fruit and Vegetable Consumption, Sugar Sweetened Beverage Consumption and Self-Rated Health.