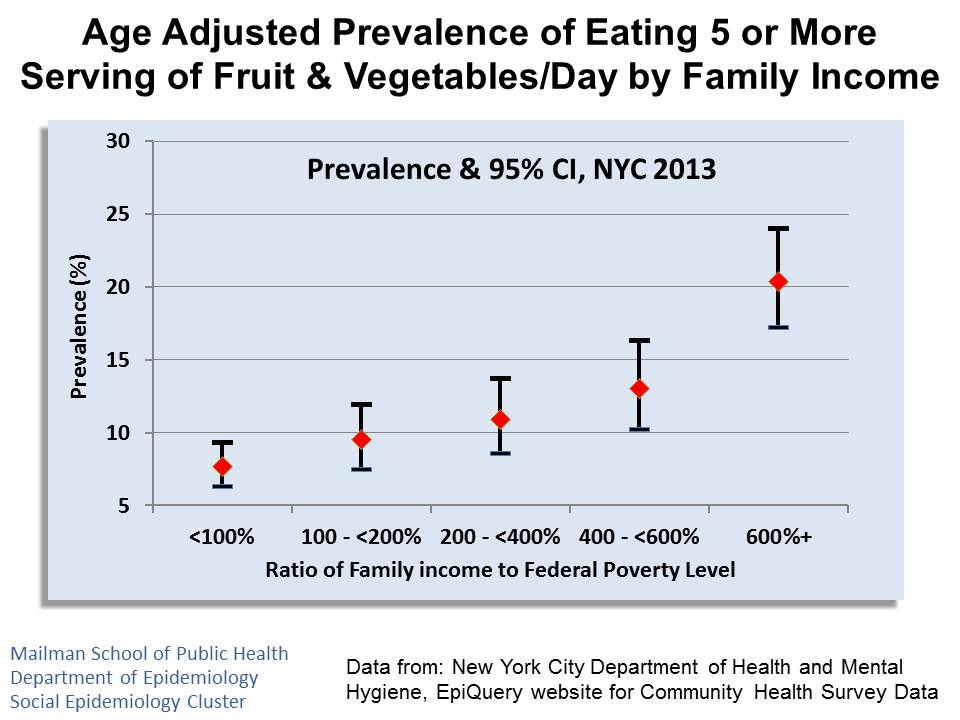
 We have been mining the NYC Department of Health and Mental Hygiene Community Health Survey data to create a series of info-graphic documenting disparities in health behaviors and conditions by race/ethnicity, educational attainment, income and neighborhood poverty rate. Thus far we have completed PowerPoint slide decks for Obesity Prevalence, Current Smoking, Fruit and Vegetable Consumption, Sugar Sweetened Beverage Consumption and Self-Rated Health.
Follow Us On:
Subscribe to Blog via Email
Search the site:
-
Recent Posts
- Social support and intimate partner violence in rural Pakistan: a longitudinal investigation of the bi-directional relationship
- Overflowing Disparities: Examining the Availability of Litter Bins in New York City
- In New York City, pandemic policing reproduced familiar patterns of racial disparities
- The COVID-19 Pandemic as a Threat Multiplier for Childhood Health Disparities: Evidence from St. Louis, MO
- Lessons Learned From Dear Pandemic, a Social Media–Based Science Communication Project Targeting the COVID-19 Infodemic
Faculty Publications on:

 PubMed Feed
- The use of once-daily LCP-Tacrolimus with adolescent and young adult solid organ transplant recipients
- Systematic disparities in reporting on community firearm violence on local television news in Philadelphia, PA, USA
- Neighborhood-level characteristics as effect modifiers on the efficacy of the MyPEEPS mobile intervention in same-sex attracted adolescent men
- Rhinorrhea and watery eyes in infancy and risk of attention-deficit hyperactivity disorder in school-age children
- Bringing home the benefits: Do pro-family employee benefits mitigate the risk of depression from competing workplace and domestic labor roles?
- Trends in police complaints and arrests on New York City subways, 2018 to 2023: an interrupted time-series analysis
- Partner incarceration, maternal substance use, and the mediating role of social support: A longitudinal analysis using the future of families and child wellbeing study
- Establishing registry-based mental health research in Latin America
- Direct potable reuse and birth defects prevalence in Texas: An augmented synthetic control method analysis of data from a population-based birth defects registry
- Adverse childhood experiences among black sexually minoritized men and Black transgender women in Chicago

