The Journal of Maps recently published an article co-authored by Andrew Rundle, Gina Lovasi and Stephen Mooney and others, showing a high resolution map of neighborhood physical disorder in New York City.
Physical disorder – the deterioration of urban spaces owing to social forces favoring neglect and abandonment – has long been of interest to social scientists [1, 2]. Criminologists and sociologists have debated the controversial ‘broken windows’ theory that disorder encourages violent crime [3, 4]. Separately, psychologists and psychiatric epidemiologists have investigated whether living amidst disorder negatively affects mental health, not only directly as stress induced by encountering a chaotic environment triggers earlier cognitive decline [5] but also indirectly as residents adopt coping mechanisms such as alcohol use that themselves trigger longer-term harms [6].
The data underlying the map was collected using neighborhood audits implemented via Street View. In addition to data collection in NYC, the team collected neighborhood physical disorder data from San Jose, California; Detroit, Michigan; and Philadelphia, Pennsylvania. Below is a heat map of Philadelphia showing the distribution of neighborhood physical disorder across the city.
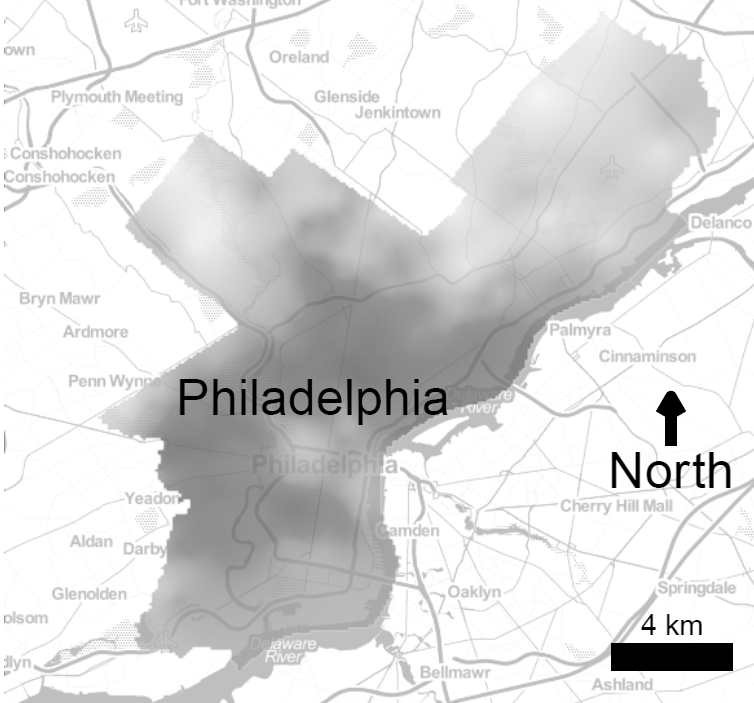
Neighborhood physical disorder in Philadelphia. Darker areas within Philadelphia have the highest levels of physical disorder.