The script has been added with the ability to do the following
1. generate geometry boundary whose center is x=3, y=3 (the geometry is currently set to circle)
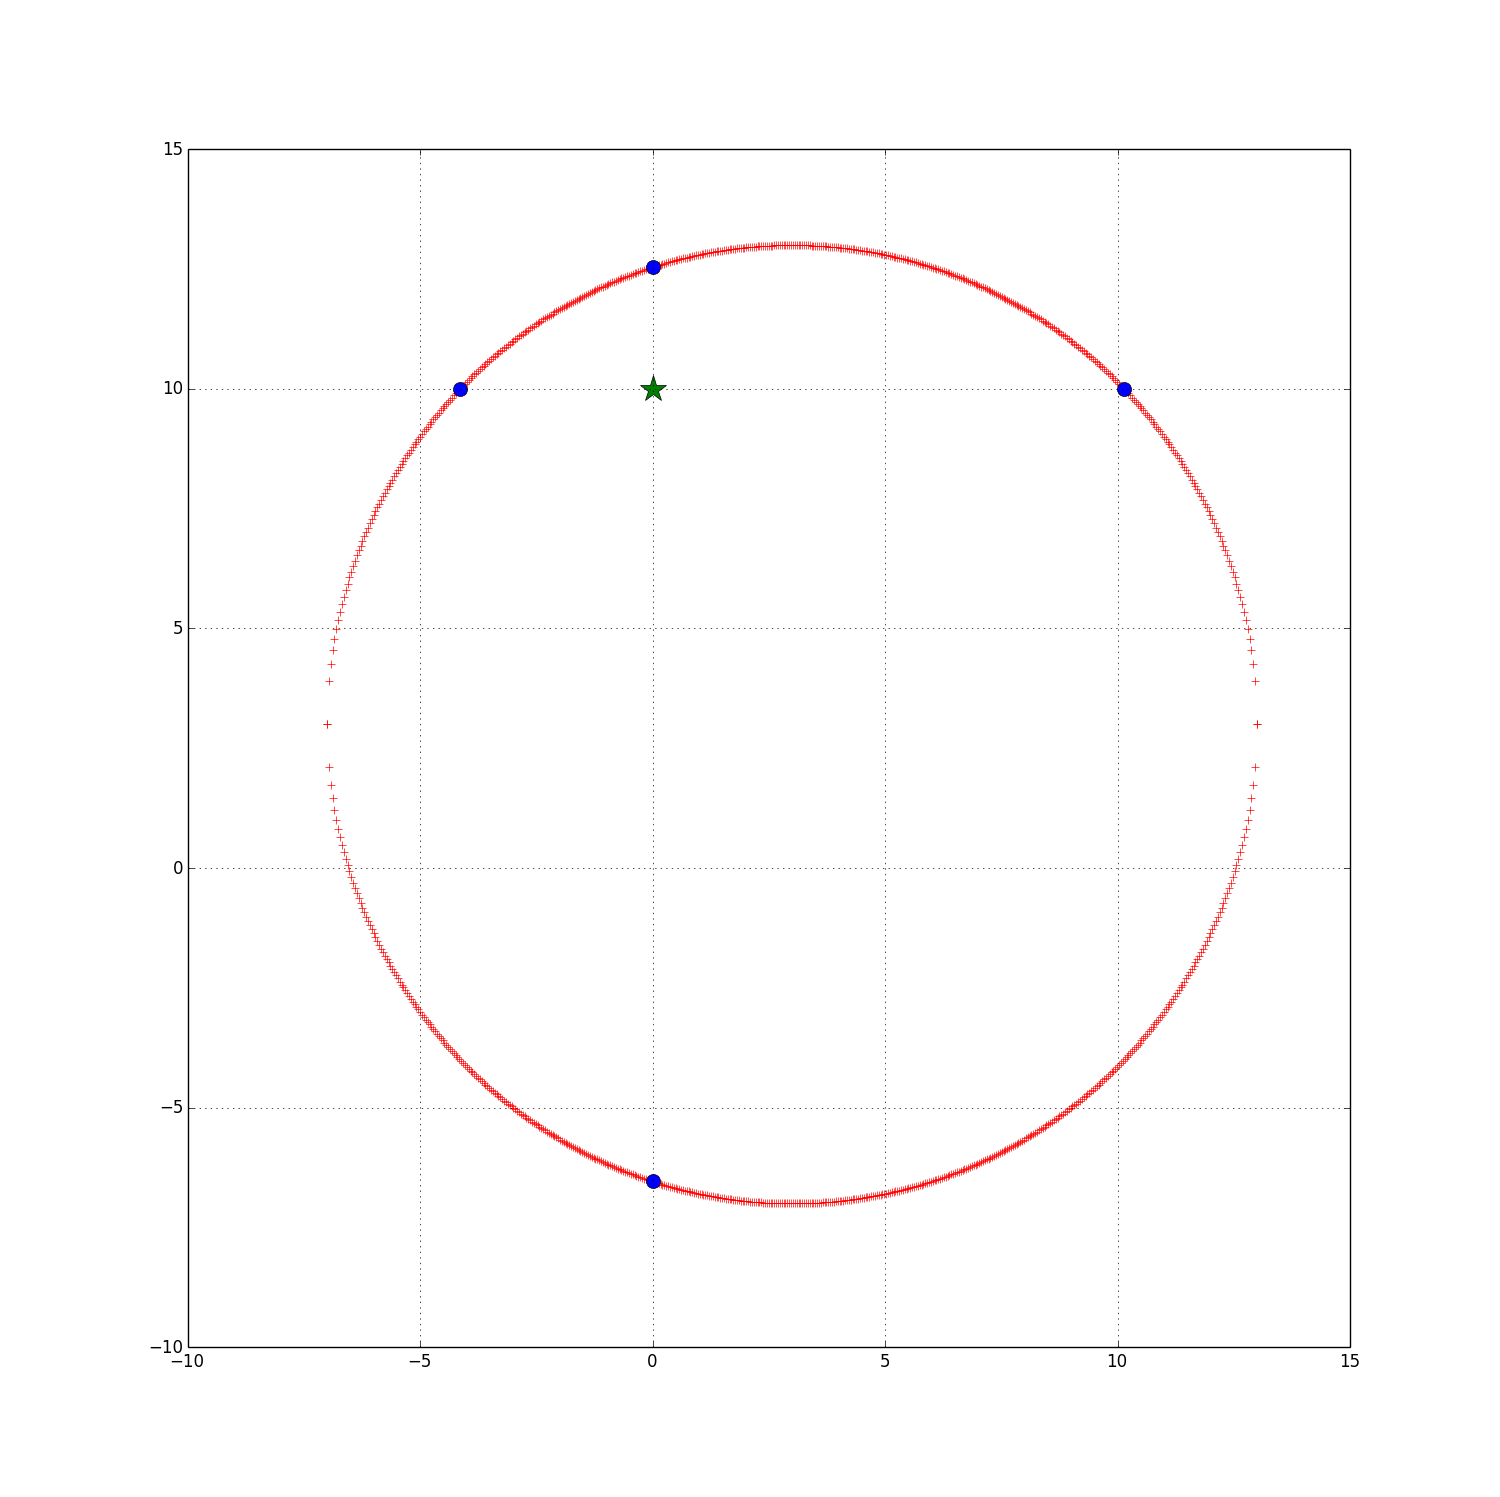
2. a circle of radius = 10 is plotted on a graph
3. the location of the pen is plotted on top of this graph
4. the edge detection is plotted on the graph
(the edge detection is basically calculating where the imaginary vertical and horizontal line originating from the pen crosses the given geometry)
To run this test script, in python console (or use the Spyder editor on our PC which comes with the mathematical packages), run
import kinematic
main(1,1)
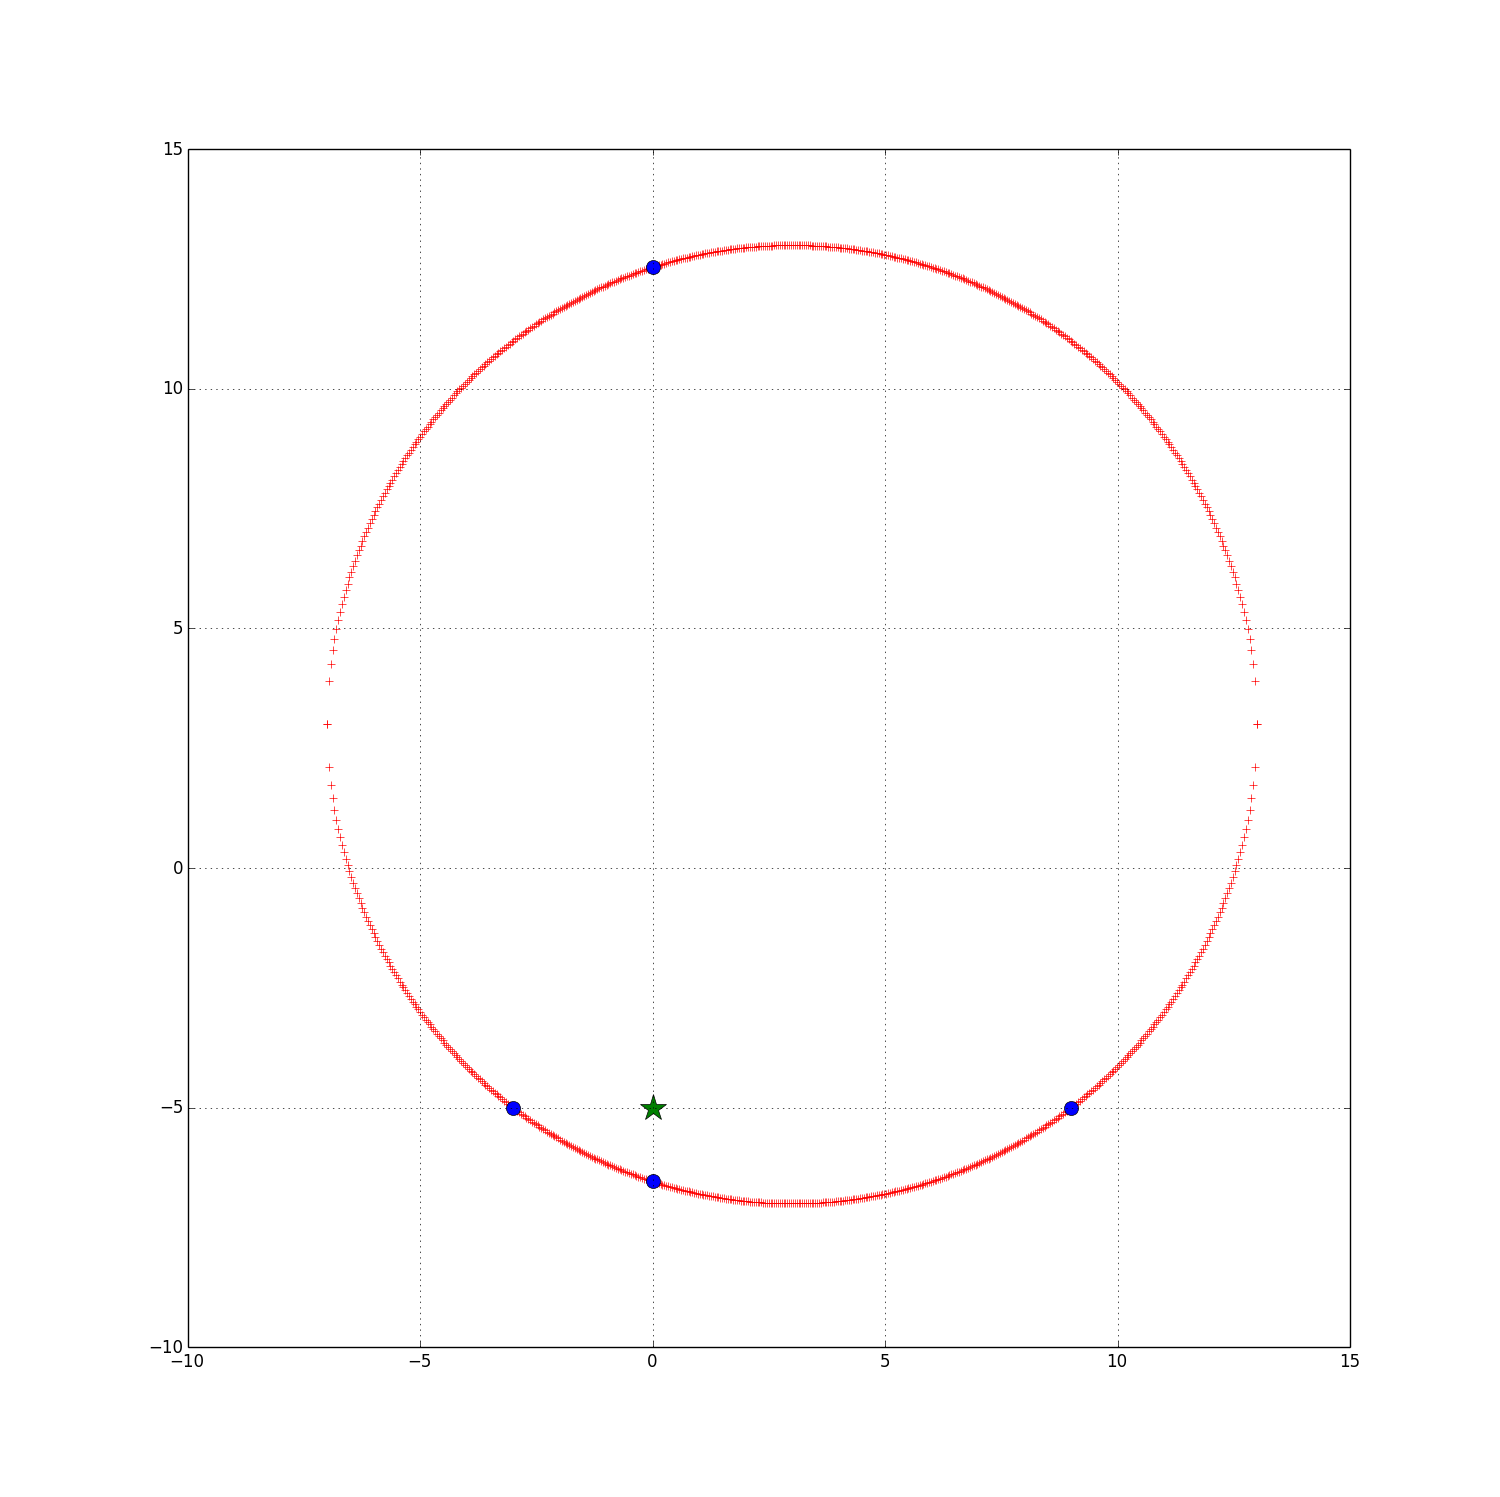
Note that main() takes two argument and is of the form main(px, py) where px and py are the x and y coordiantes of the pen.The purpose of this test script is to manually enter different values of px, and py and observe that the edge detection properly shows up on the figure.one can try the following sequence of test to observe that it works, and also see the photo for visual test output:main(0,-5)
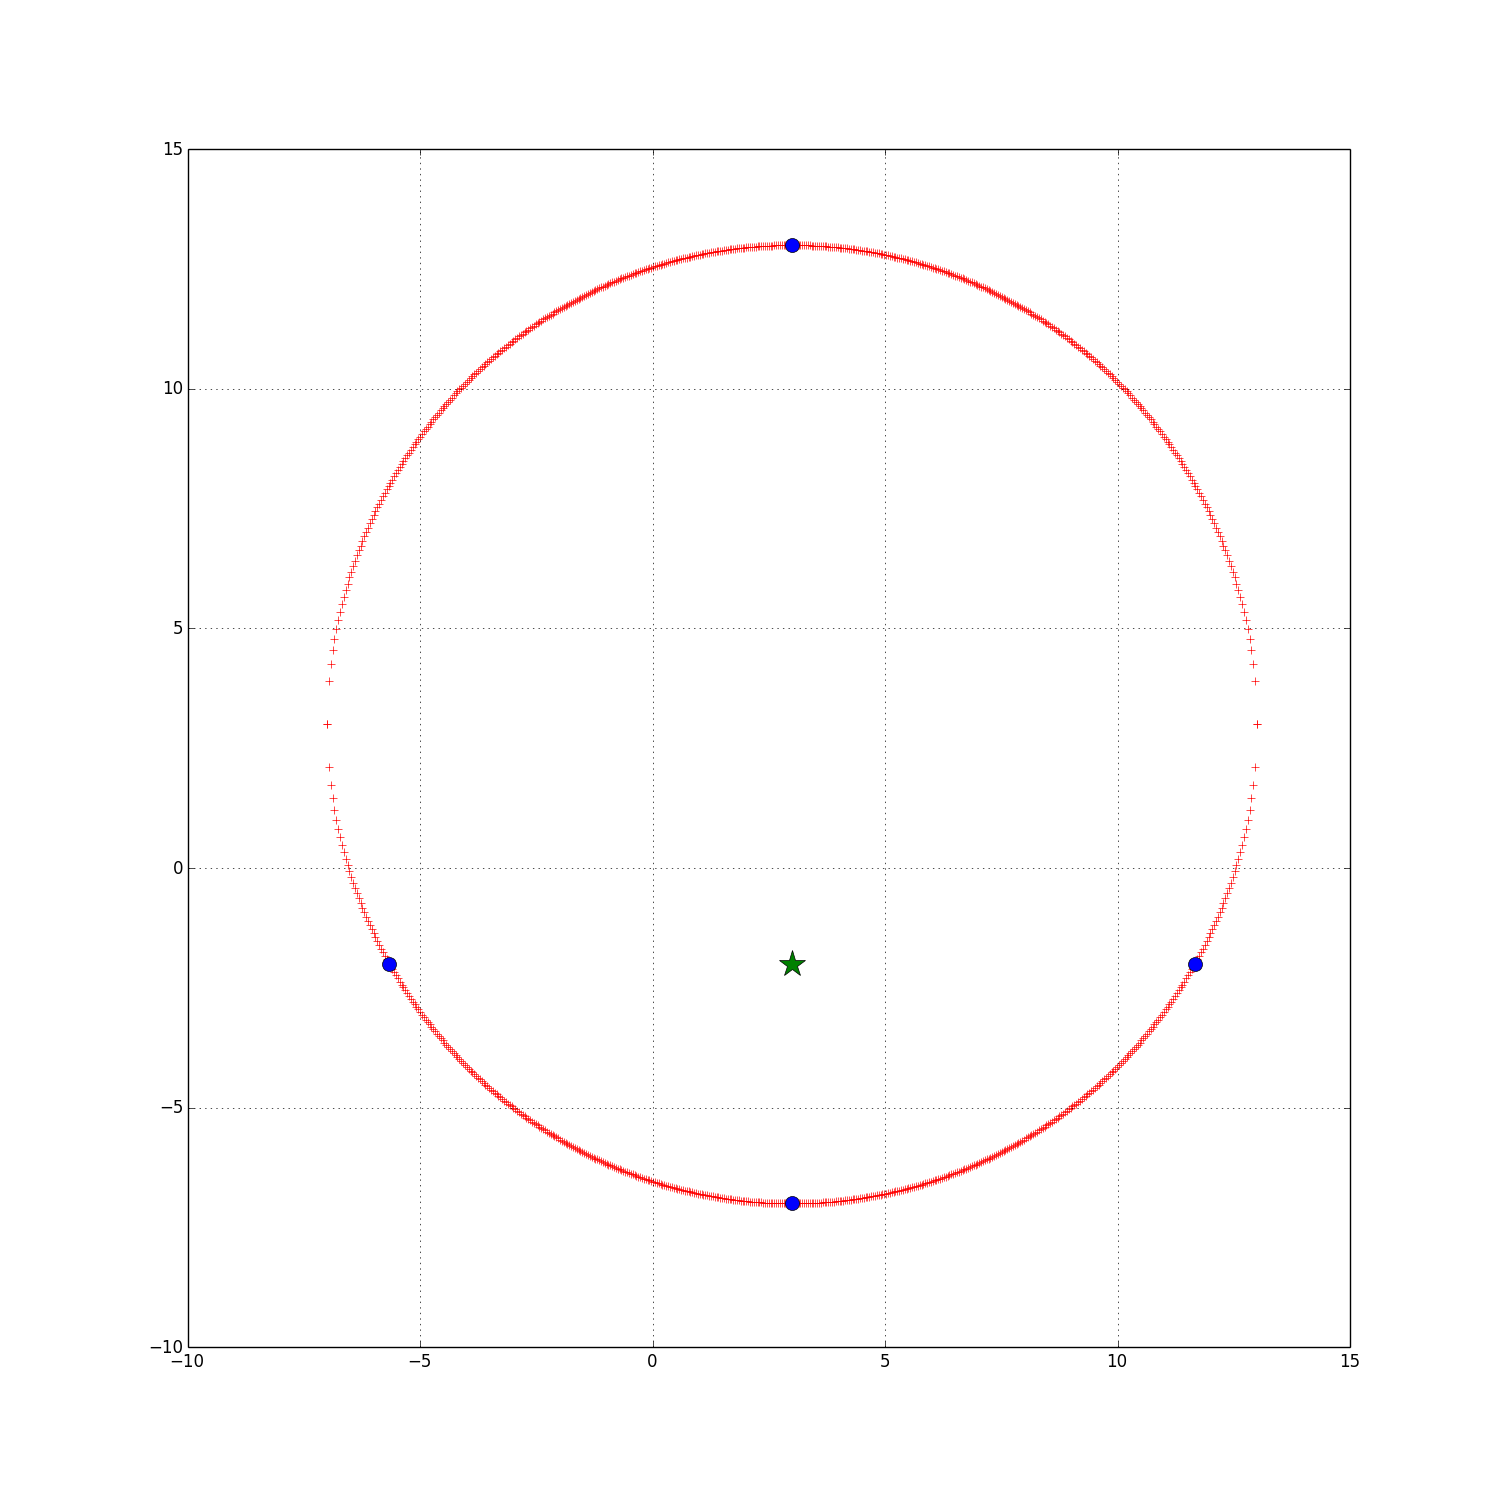
main(3,-2)
main(5,5)
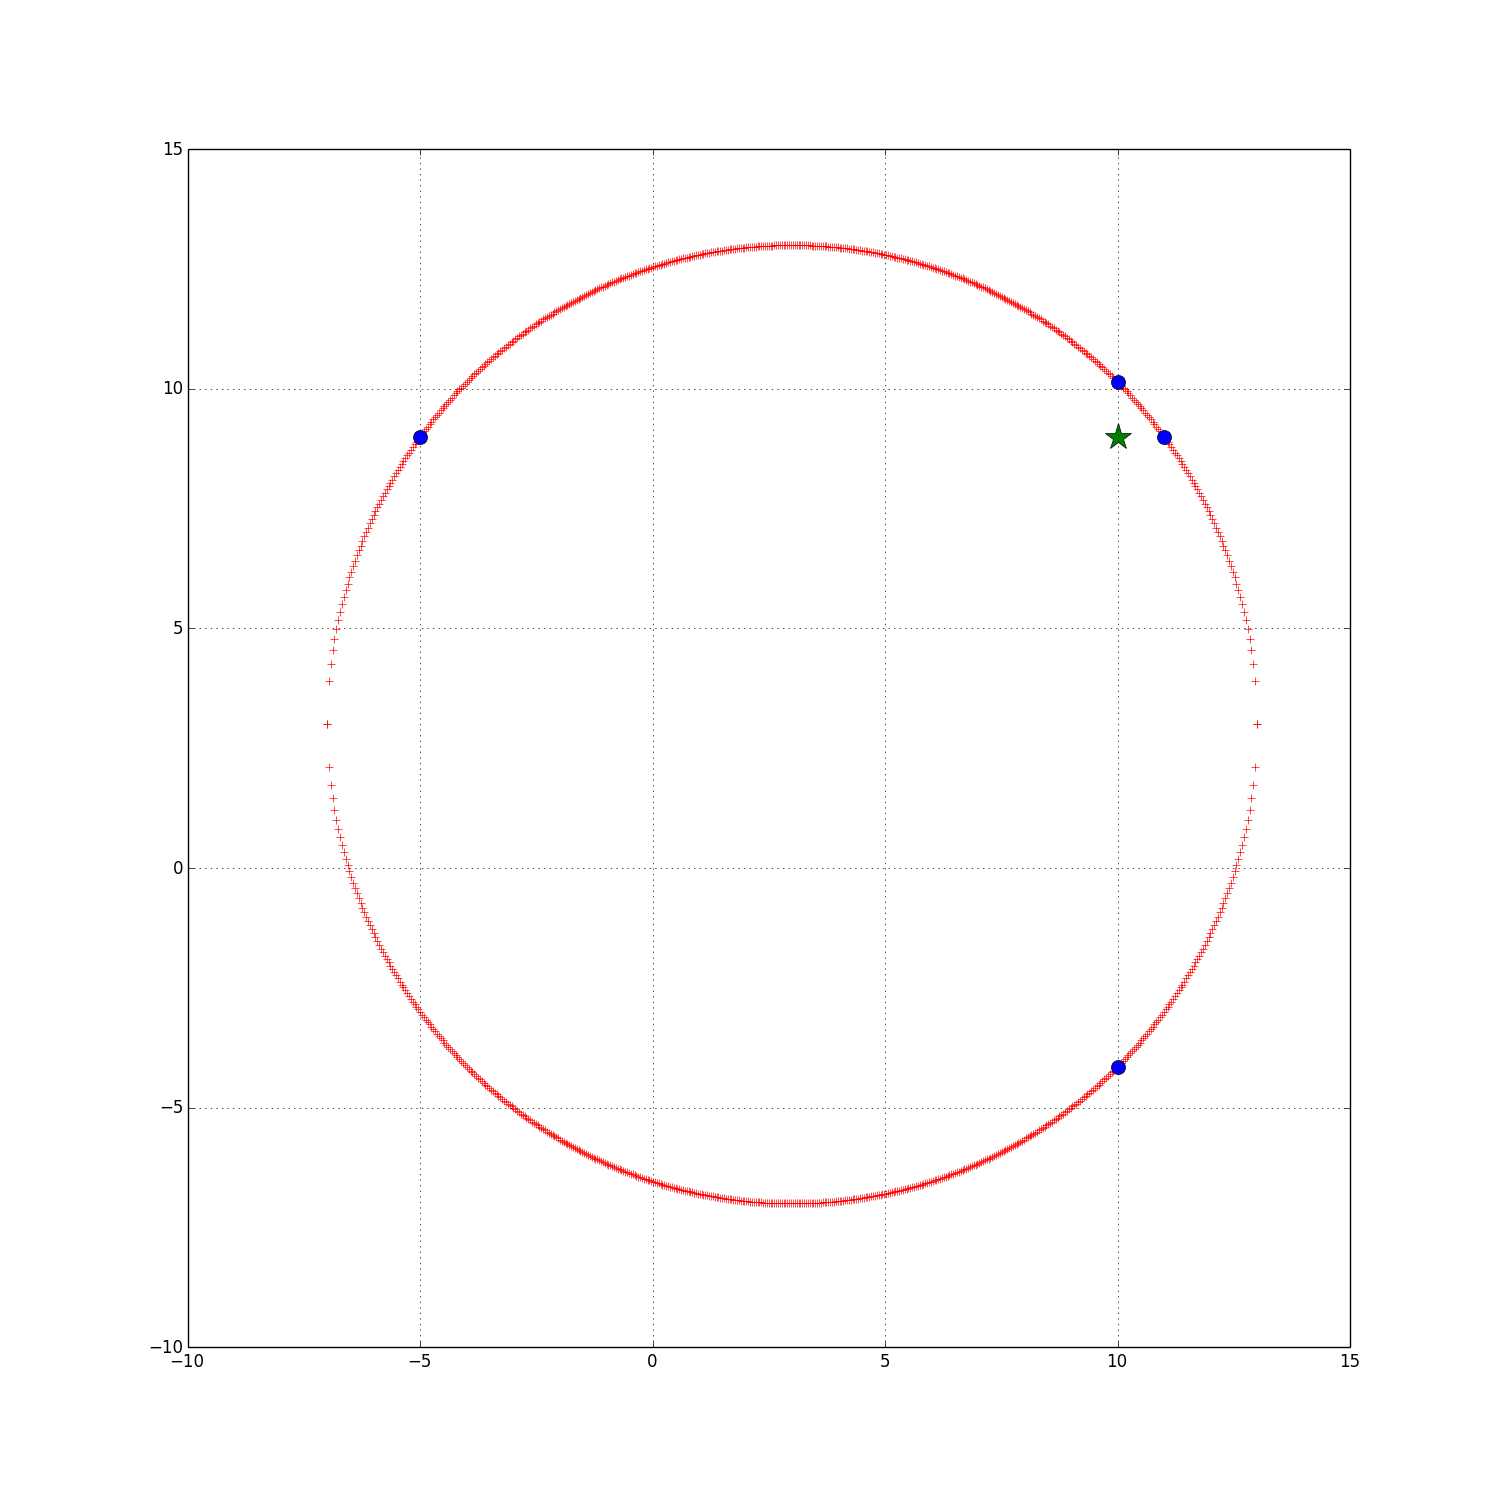
main(10,9)
main(0,10)
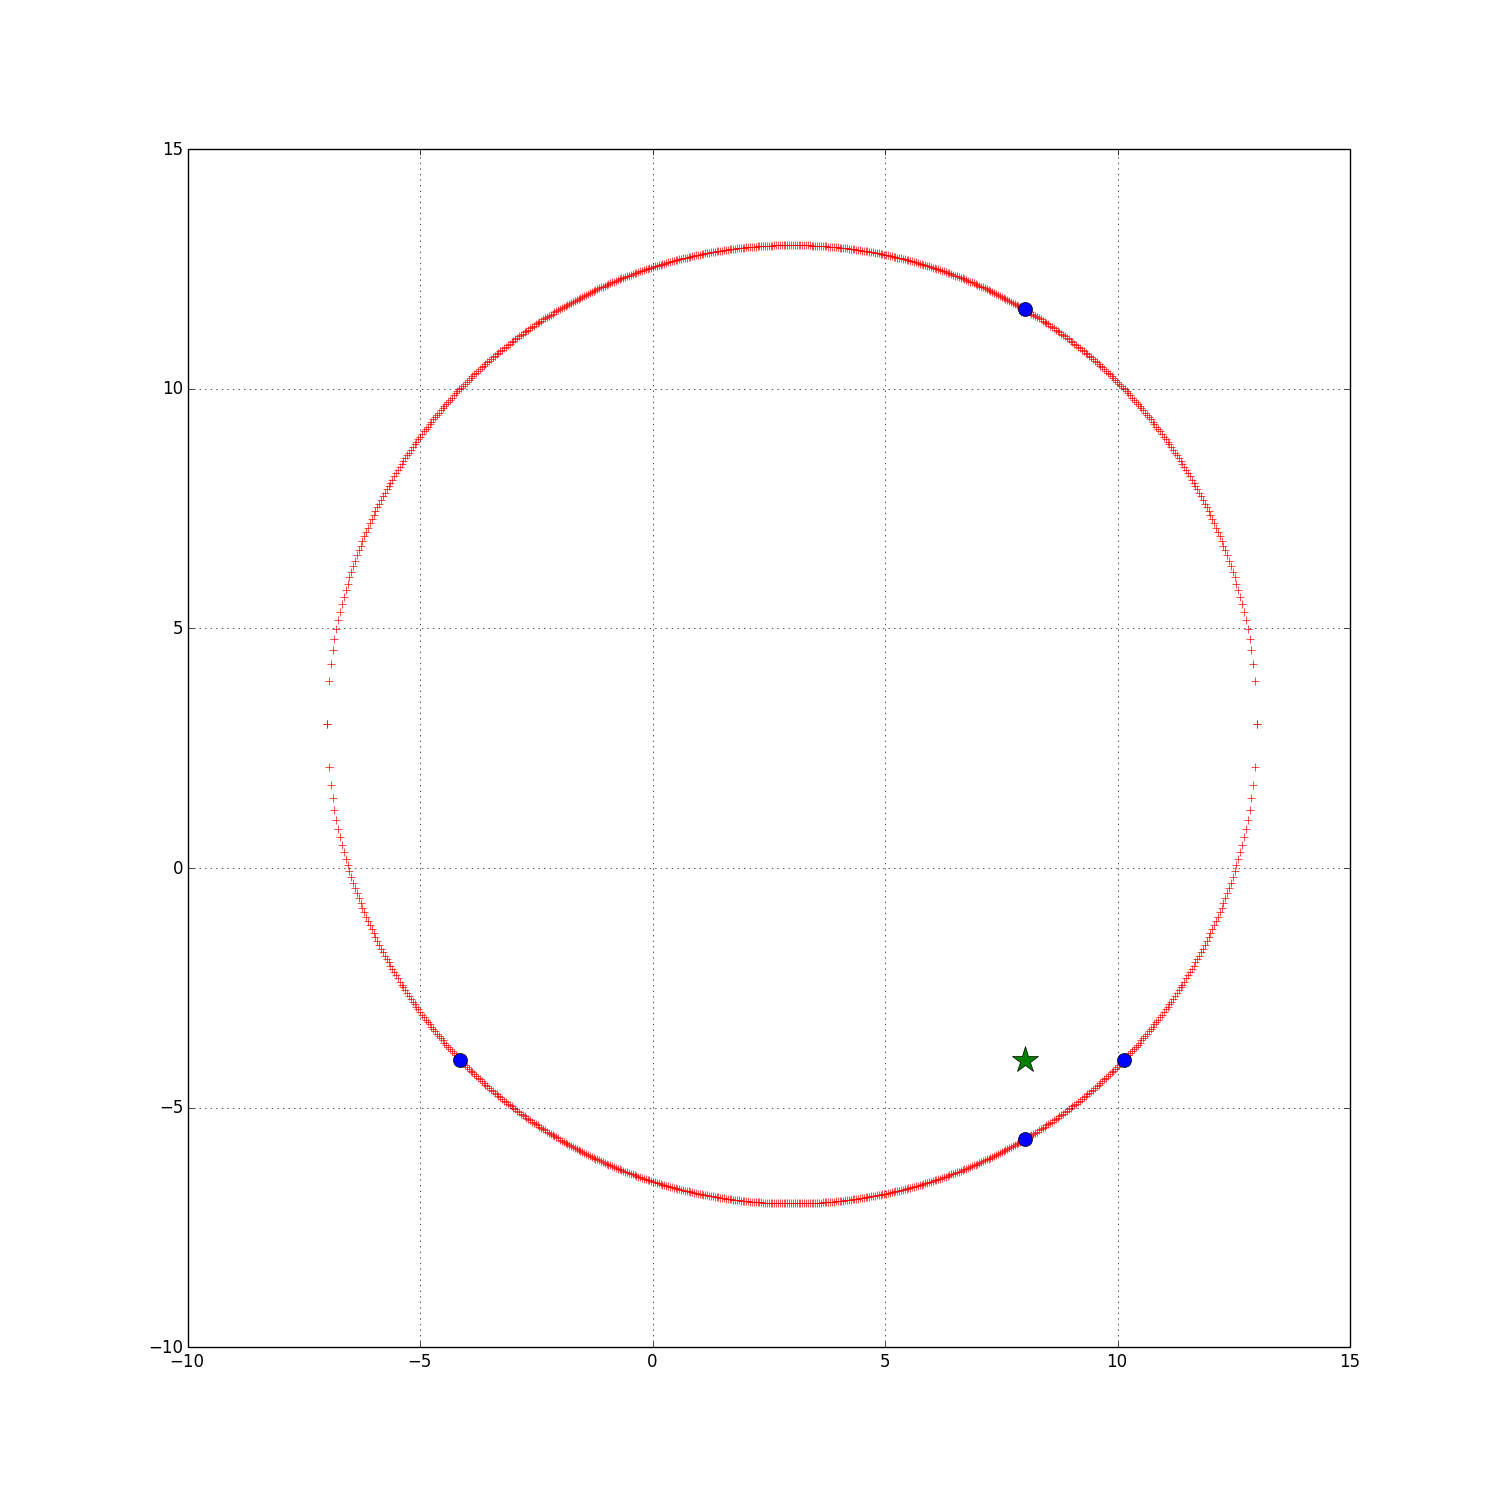
main(8,-4)
main(3,-2)
main(5,5)
main(10,9)
main(0,10)
main(8,-4)
>>> main(0,-5)
Pen Location: xtest= 0, ytest= -5
Edge Y_top= 12.539370956, Y_bottom= -6.53937095597
Edge x_left=-2.99996656211, x_right= 8.99996656211
(-2.9999665621073452, 8.9999665621073461, 12.539370955969433, -6.5393709559694333)
>>> main(3,-2)
Pen Location: xtest= 3, ytest= -2
Edge Y_top= 12.9999799197, Y_bottom= -6.99997991974
Edge x_left=-5.66016334513, x_right= 11.6601633451
(-5.660163345134456, 11.660163345134457, 12.999979919739197, -6.9999799197391965)
>>> main(5,5)
Pen Location: xtest= 5, ytest= 5
Edge Y_top= 12.7979384734, Y_bottom= -6.79793847337
Edge x_left=-6.79788170087, x_right= 12.7978817009
(-6.7978817008708248, 12.797881700870825, 12.797938473371332, -6.7979384733713317)

>>> main(10,9)
Pen Location: xtest= 10, ytest= 9
Edge Y_top= 10.1414002015, Y_bottom= -4.1414002015
Edge x_left=-4.9999748599, x_right= 10.9999748599
(-4.9999748599008118, 10.999974859900812, 10.141400201504284, -4.1414002015042835)
>>> main(0,10)
Pen Location: xtest= 0, ytest= 10
Edge Y_top= 12.539370956, Y_bottom= -6.53937095597
Edge x_left=-4.1413783716, x_right= 10.1413783716
(-4.1413783716021175, 10.141378371602118, 12.539370955969433, -6.5393709559694333)
>>> main(8,-4)
Pen Location: xtest= 8, ytest= -4
Edge Y_top= 11.6602308201, Y_bottom= -5.66023082006
Edge x_left=-4.1413783716, x_right= 10.1413783716
(-4.1413783716021166, 10.141378371602118, 11.660230820056825, -5.6602308200568254)