Final Report posted
Written on April 20, 2013 – 5:42 pm | by ac45
The final report for this project is now available.
Pilot project to "green" CUIT's Data Center sponsored by NYSERDA
The final report for this project is now available.
See Measuring and Managing a Datacenter Shutdown about a recent cooling shutdown we performed and how we were able to successfully manage it using electrical and cooling metering that were installed in the Data Center as part of the NYSERDA project.
See the NYSERDA site for more information, especially the Data Center Energy Efficiency Framework (DCEEF) guidelines.
|
Reducing Costs in Healthcare and Higher Educationthrough Green IT: The Changing Impact of IT on Energy Consumption & Operating Costs |
 |
The New York State Energy Research and Development Authority invites you to join our expert panel on Monday, November 14th:
This panel will bring together leaders in the healthcare and higher education sectors to discuss how energy consumption and costs affect organizational IT decisions and capital investments. Over the last decade, hospitals and universities have seen a significant increase in energy consumption from IT infrastructure. New requirements for maintaining electronic records and rising demands from end users coupled with soaring electricity costs have made IT-related energy costs a major operating expense. Aside from saving money, the motivation to install energy-efficient technology is amplified as more and more hospitals and universities incorporate environmental sustainability into their organizational missions.
Monday, November 14th
8:30-10:30am CUNY Graduate Center, Skylight Conference Room #9100
365 5th Avenue, New York, NY 10016
To RSVP, contact Anastasia Wright at [email protected] or 212-701-7294
Click here to learn more about NYSERDA’s data center efficiency programs.
|
CUIT held it’s recurring External Review meeting on 6/6/11. Guests enjoyed Dinosaur BBQ while discussing Columbia and NYSERDA’s Advanced Concepts Data Center Project. Initial results were shared with the group along with discussions on relevant green data center best practices, refining CUIT’s measurements and preliminary findings from CUIT’s airflow study. CUIT looks forward to the next meeting.
Presentation:
Please register for this free event on January 27th, 2011 in Armonk, NY, sponsored by Con Edison, IBM and NYSERDA:
Improving the ROI for Energy Efficient IT
This interactive discussion will focus on what the path forward for energy efficient data centers should look like. This session will feature insights from our panel of subject matter experts and leading practitioners. The intent is to provide a forum for you to learn about best practices or put forward the key challenges you see ahead.
Topics will include energy efficient technology and practices to extend the life of data center investments, measuring and managing energy usage of data centers, and how available incentive programs can improve your ROI for energy efficiency projects.
SPONSOR: NYSERDA
CO-SPONSOR: IBM and Consolidated Edison Company of New York
Con Edison and NYSERDA Efficiency Programs
WHEN: 1/27/2011 at 8:30 a.m. – 11:00 a.m.
WHERE: IBM Learning Center, 20 Old Post Road, Armonk, NY 10504
SPEAKER: Michael Colgrove, NYSERDA; David Pospisil, Con Ed; Rich Lechner, IBM; Susan Gunn, Con Ed; Sandy Hwang, NYSERDA; and Moderator Brian Schafer, 7×24 NY Chapter
ADMISSION COST: FREE – Registration Required
FOR MORE INFORMATION: Contact Sandy Hwang or call 518.862.1090 x3009 or email [email protected] or visit www.nyserda.org/data-centers
See Joyce Dickerson’s presentation on 10 Steps to Datacenter Energy Efficiency at Stanford’s sustainable IT site. Also of note is Stanford’s program with Pacific Gas and Electric to provide incentives to consolidate and/or virtualize servers.
Despite the weather, the workshop was a great success! There was a lot of information sharing and networking accomplished. Hopefully, everyone who attended came away with some new knowledge, contacts and ideas.
CUIT is very thankful to all those who attended and participated and helped make this a successful event.
For those who could not attend, I am posting the presentations below.
Happy New Year!
Rich Hall
Jan 7th Workshop Presentations:
The video embedded below shows the PUE of Columbia’s Data Center from January 2010 to November 2010. The top half of the animation shows separately the IT and cooling power consumption (in yellow and green, respectively) and the total power consumption (in blue). The bottom half displays the Power Usage Effectiveness (PUE) in red, which is the ratio of the total power load to the IT load. During the summer months, the PUE hovers around 2.2. We see it decline towards 2.0 into November as the cooling power consumption decreases. Accurate cooling data was not available until April, and so the PUE is too low and unreliable until then.
Please watch the animation in 1080p, as the quality suffers considerably at lower resolutions.
[youtube width=”800″ height=”800″]http://www.youtube.com/watch?v=nstDs1nZT8k[/youtube]
Columbia University’s Advanced Concept Data Center Pilot Project
Winter Workshop
Hosted by Columbia University Information Technology (CUIT)
January 7, 2011
AGENDA
9:00am Registration & Breakfast
9:30 – 10:15 Welcome and Opening Remarks
How University IT and Facility organizations can work most effectively together to improve energy use in Data Centers
10:30 – 11:15 Data Center Best Practices – Electrical and Cooling Overview
Data center electrical and cooling infrastructure basics
11:30 – 12:30 Columbia University’s Advanced Concepts Data Center Pilot project
Overview of Columbia University’s Advanced Concepts Data Center Pilot project – successes, challenges, lessons learned, etc.
12:30– 1:30pm Lunch
1:30 – 2:15 Syracuse University’s Data Center
Syracuse University’s new Green Data Center has a one-of-a-kind integration a number of data center technologies in one facility, including water cooling at the rack, DC power, tri-generation, and virtualization. Together, we will walk through the layers of the operation, including the facility layout, power, cooling, and virtualization and discuss elements of design and efficiency at each layer.
2:30 – 3:15 New York University’s Data Center
3:30 – 5:00 Closing Comments/Open Discussion
5:00pm Meeting Adjourned
On Thursday, October 14, 2010, Richard Hall and Alan Crosswell presented ” Measuring and Validating Attempts to Green Columbia’s Data Center” at Educause 2010.
ABSTRACT: Columbia University began a pilot in April 2009 to measure energy usage and verify the benefits of techniques to improve energy efficiency of our data center. This presentation will provide an assessment of those efforts and should help attendees understand what works and what doesn’t when trying to green a typical university data center.
See the article, entitled “Data Center Takes Big Steps in Going Green”
The data center has a pipe loop containing chilled water that flows through a Plate Frame Heat Exchanger (PFHX) as well as via thermostatically controlled butterfly valves to dry coolers on a nearby roof. This is called the secondary loop as the primary loop is one of several campus-wide chilled water loops that provides approximately 43-45 degree water to the PFHX. The size of our PFHX supports about 100-120 tons of heat transfer capacity.
The campus chilled water system is over 1000(?) tons and provides chilled water to most buildings on campus. It uses evaporative cooling towers and can operate either electrically or under steam power. Steam power is used when electrical demand load reductions are needed.
We have 6 Liebert Computer Room Air Conditioners (CRAC) of a recent vintage (2006) which are connected to the secondary chilled water loop. Warm air is sucked in the top, flows over cooling coils, and is pumped out the bottom, under the raised floor. These units have two modes of operation which is accomplished with a three-way water valve in each unit. The valve allows automated switching between water-side economy mode and direct expansion (DX) cooling.
The water-side economizer mode flows room air over a coil that is directly connected to the secondary loop, which nominally operates at about 45 degrees in and maybe 55 degrees out. This is the most efficient operating mode as no compressors are used. Each CRAC has about 15 tons of cooling capacity when in this mode. If this was the only way these units worked, they would technically be called CRAHs (for Computer Room Air Handlers).
Each CRAC unit also has a refrigerant-based direct expansion (DX) cooling coil and a compressor. This has a coil that exchanges heat with air flowing over it and in turn compresses the refrigerant. Exhaust heat is exchanged via a heat exchanger to the secondary chilled water loop. The DX mode only operates when the available cooling from the water-side economizer is insufficient, either because there is more than 15 tons of load from the warm air entering the CRAC or because the chilled water temperate is too high to remove sufficient heat. When the DX mode operates, a significant electrical load is incurred to run the compressors. The DX mode gets the Lieberts up to their full rated capacity of about 20 tons. When operating in DX mode, the chilled water temperature can potentially be much higher than the usual 45 degrees — as much as 100 or more degrees.
In the event that the water temperature of the primary chilled water plant rises above about 70(?) degrees (e.g. due to a central chilled water plant shutdown), thermostatically controlled butterfly valves divert the secondary chilled water around the PFHX and up to the rooftoop dry coolers, which are essentially large radiators with fans that blow outdoor ambient air across them. In this operating mode, the secondary chilled water can get to 100 degrees or more and is cooled down to near the outdoor ambient air temperature. When this happens, the CRACs must run in DX mode since their cooling water is too hot for water-side economizing.
Due to the use of backup dry coolers vs. the central chilled water plant, the secondary loop temperature which normally operates at 45 degrees can sometimes operate at 100 degrees. This dichotomy makes it difficult to employ a number of water cooling technologies for in-row or rack-based cooling which generally want to “see” water in the 45-55 degree range (some vendors can push the limit to about 70 degrees). None of the products we are currently aware of have similar capacity to the CRACs to operate in these two temperature ranges. This makes it difficult to employ in-row or in-rack cooling for critical services that need to keep running when the central chilled water plant is shut down.
In addition to the secondary loop feeding the 6 CRACs on the data center floor (and three additional CRACs when the floor was larger before part of it was turned into office space), there are two Air Handling Units (AHUs) in the basement mechanical room. These units are directly connect to the primary chilled water loop and have large fans and ductwork that pump air to- and from the data center floor and the adjacent offices in the Computer Center building. Each of the two AHUs has about 10 tons capacity. The AHUs also bring in outside fresh air. Because these air handlers lack compressors (and they are on the primary chilled water loop) they do not have an emergency backup when the central chilled water plant is down.
From the late Fall through early Spring, Facilities HVAC mechanics switch these AHUs into air-side economizer mode in which they essentially pump cold outdoor air (through filters, of course) into the data center. This is sometimes referred to as free cooling, although there is of course a fan energy cost.
I’ll be giving a talk about our project at the GreenMetrics 2010 conference (which is part of ACM SigMetrics 2010) on Monday, June 14th.
US EPA releases Energy Star rating for data centers June 10, 2010
by ian0
Facilities with PUE’s in top 25 percentile of peers can get efficiency label!
One aspect of determining our Power Use Effectiveness (PUE) is to understand how much energy is “wasted” by our UPSes. This is especially important as we look to move from many small rack-mounted UPSes to a more central approach. We’ve been quite confused in reading about the relationships of Real and Apparent power and Power Factor and how that relates to efficiency.
In Power Basics for IT Professionals (HP, October 2007) this description of Power Factor is provided (my highlighting):
The power factor (PF) of a device is a number between zero and one that represents the ratio between the real power in watts and the apparent power in VA. A power supply that has a PF of 1.0 indicates that the voltage and current peak together (the voltage and current sine waves are always the same polarity), which means that the VA and watt values are the same. A device with a Power Factor of 0.5 would have a watt value that is half the VA value; for example, a 400VA device with a Power Factor of 0.5 would be a 200W device.
A common misconception is that the power factor and the power supply efficiency are related, but this is not the true. Power supply efficiency is the ratio of output power in watts to input power in watts at peak efficiency. For example, a typical white box power supply with a peak efficiency of 75 percent would waste at least 25 percent of the incoming energy by converting it to heat that must then be dissipated. HP ProLiant server power supplies all have peak efficiencies of 85 percent or greater, which increases the amount of power that performs useful work.
Devices with a low power factor, on the other hand, do not waste energy. Unused energy is simply returned to the utility and is not paid for by the customer. Utilities charge for true power used as measured in kWhours, not in VA. The main costs associated with a low power factor are for higher amperage circuits to deliver the same amount of true power as a device with a power factor closer to one.
Power supplies for servers usually contain circuitry to correct the power factor (that is, to bring input current and voltage into phase). Power-factor correction allows the input current to continuously flow, reduces the peak input current, and reduces energy loss in the power supply, thus improving its operational efficiency. Power-factor-corrected (PFC) power supplies have a power factor near unity (~1), which allows smaller circuits to be used. Using energy-efficient PFC devices, including UPSs, can lead to significant cost savings for data centers where the incoming feeds are measured in megawatts. As a standard feature, power supplies for ProLiant servers all contain circuitry to correct the power factor (that is, to bring input current and voltage into phase).
The above statement about apparent power (VA) vs. real power (W) and how it’s billed for is somewhat contradicted in Horowitz & Hill, The Art of Electronics, 2nd Edition (ISBN 0-521-37095-7) page 35 (again, my highlighting):
Power factor is a serious matter in large-scale electrical power distribution, because reactive currents don’t result in useful power being delivered to the load, but cost the power company plenty in terms of I^2R heating in the resistance of generators, transformers and wiring. Although residential users are billed for “real” power [Re(VI)*], the power company charges industrial users according to the power factor. This explains the capacitor yards you see behind large factories, built to cancel the inductive reactance of industrial machinery (i.e., motors).
Ok, so we now understand that Power Factor matters and that we should make sure our power systems provide Power Factor Correct (PFC) if possible. We are already measuring Power Factor with our Wattnode meters as well as with the SNMP-monitored UPSes.
An article in Wikipedia (a truly unbiased source of peer-reviewed information clearly written by a vendor of IGBT technology:-) states:
The major discussion point of an ECO UPS is its efficiency savings. A true “double conversion” ECO friendly UPS must use input and output IGBT technology, only then can a UPS hope to reach a 95% AC to AC efficiency, this efficiency is typically more than 10 to 20% higher than a six or twelve pulse alternative. An ECO IGBT UPS should also benefit from a high input power factor (.99pf) and low reflected harmonics, these two crucial features, apart from reducing running costs, also dramatically lower installation costs as smaller cables and MCB’s (Fuses) can be used.
An ECO UPS should always have a IGBT input stage and as a benefit of this, reflected electrical noise back to the utility supply should be less than three percent (<3%), this low reflected distortion results in electronic equipment up stream from the UPS being much less susceptible to interference (ideal for hospitals).
Another important consideration, with regard to THD is that most European countries are looking at imposing penalties on companies that excessively pollute the electrical grid, distortion levels should be low from any reputable ECO UPS and as such should not fall foul to these proposed financial penalties.
A secondary but very important feature of a quality ECO UPS is when considering using a generator to support your UPS, because reflected distortion is so low a substantially smaller engine and alternator can be used. Typically when calculating the size of a generator to run with a none ECO UPS a factor of 2.5 would be applied, example, a standard 100kVA UPS would require a 250kVA generator, the same 100kVA requirement but with ECO UPS features would only require a 120kVA set, a factor of 1.2, this is 52% smaller and offers profound ecological and financial benefits.
So we can conclude that:
We still have more work to do to measure and understand our UPS conversion losses but should probably be looking at them in turns of Input vs. Output Apparent Power as a most conservative case.
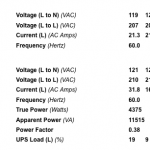
Here’s a screen shot from the web management console of our new Eaton blade UPS which is still very lightly loaded:
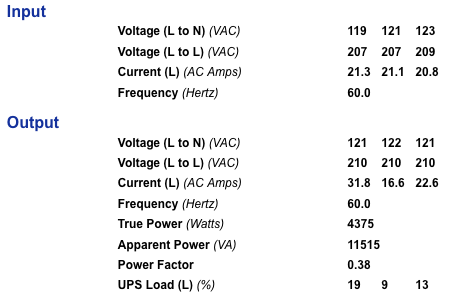
I need some help here! How is the Apparent Power calculated? Given this is a 3-phase system, if it were balanced, and we knew the overall Amperage, the VA would be V x A x 1.732 (√3). But we don’t have just A, but rather A1, A2 and A3 (and similarly V1, V2, and V3) for the three phases. Furthermore, it is pretty unbalanced with a range between 31.8 A on one leg and of 16.6 A at the other extreme. Working backwards from what the UPS tells us is the Apparent Power of the Output, 11515/210/1.732 = 31.66 A which is close to the worst case. Using the worst-case approach for the Input Apparent Power (and given the currents are pretty close to one another), let’s say the Input Apparent power is 209 * 21.3 * 1.732 = 7710 VA. Which is less than the output Apparent Power, so clearly I’m doing something wrong here.
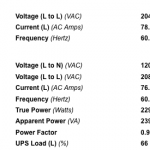
Below is a screen shot from the older Eaton 9315 which powers the mainframe, p-Series and EMC storage systems (we just recently installed a network monitoring card in this 5-10 year old device):
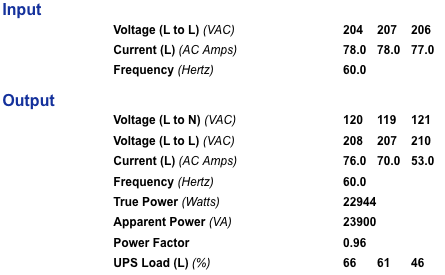
These numbers seem to make more sense. Calculate an Input Apparent Power of say 207*78*1.732 = 27,965 VA. Output Apparent Power is shown as 23,900 VA, which when working backwards gets 23,900 VA/208 V/1.732 = 66.3 A! Maybe the amperages have to be averaged: (76+70+53)/3 = 66.3. In any case, we can now guess that our UPS conversion efficiency is 23,900/11,515 = 85% which seems to be in the expected ballpark.
One thing to note is that both Eaton’s (claim) to present a balanced load to the utility even though they are hiding a pretty unbalanced load (+- 15 A and 23 A for the two UPSes, respectively). This should result in a desirable near-zero neutral current presented to the upstream distribution network.

Quoting from that HP paper (with my use of italics to highlight a controversial statement):
The power factor (PF) of a device is a number between zero and one that represents the ratio between the real power in watts and the apparent power in VA. A power supply that has a PF of 1.0 indicates that the voltage and current peak together (the voltage and current sine waves are always the same polarity), which means that the VA and watt values are the same. A device with a Power Factor of 0.5 would have a watt value that is half the VA value; for example, a 400VA device with a Power Factor of 0.5 would be a 200W device.
A common misconception is that the power factor and the power supply efficiency are related, but this is not the true. Power supply efficiency is the ratio of output power in watts to input power in watts at peak efficiency. For example, a typical white box power supply with a peak efficiency of 75 percent would waste at least 25 percent of the incoming energy by converting it to heat that must then be dissipated. HP ProLiant server power supplies all have peak efficiencies of 85 percent or greater, which increases the amount of power that performs useful work.
Devices with a low power factor, on the other hand, do not waste energy. Unused energy is simply returned to the utility and is not paid for by the customer. Utilities charge for true power used as measured in kWhours, not in VA. The main costs associated with a low power factor are for higher amperage circuits to deliver the same amount of true power as a device with a power factor closer to one.
Power supplies for servers usually contain circuitry to correct the power factor (that is, to bring input current and voltage into phase). Power-factor correction allows the input current to continuously flow, reduces the peak input current, and reduces energy loss in the power supply, thus improving its operational efficiency. Power-factor-corrected (PFC) power supplies have a power factor near unity (~1), which allows smaller circuits to be used. Using energy-efficient PFC devices, including UPSs, can lead to significant cost savings for data centers where the incoming feeds are measured in megawatts. As a standard feature, power supplies for ProLiant servers all contain circuitry to correct the power factor (that is, to bring input current and voltage into phase).
———-
The above statement about apparent power (VA) vs. real power (W) and how it’s billed for is somewhat contradicted in Horowitz & Hill, The Art of Electronics, 2nd Edition (ISBN 0-521-37095-7) page 35:
Power factor is a serious matter in large-scale electrical power distribution, because reactive currents don’t result in useful power being delivered to the load, but cost the power company plenty in terms of I^2R heating in the resistance of generators, transformers and wiring. Although residential users are billed for “real” power [Re(VI)*], the power company charges industrial users according to the power factor. This explains the capacitor yards you see behind large factories, built to cancel the inductive reactance of industrial machinery (i.e., motors).
——————–
From Wikipedia (an truly unbiased source of peer-reviewed information clearly written by a vendor of IGBT technology:-)
at http://en.wikipedia.org/wiki/Eco_UPS#Double_Conversion_Efficiency_Savings
The major discussion point of an ECO UPS is its efficiency savings. A true “double conversion” ECO friendly UPS must use input and output IGBT technology, only then can a UPS hope to reach a 95% AC to AC efficiency, this efficiency is typically more than 10 to 20% higher than a six or twelve pulse alternative. An ECO IGBT UPS should also benefit from a high input power factor (.99pf) and low reflected harmonics, these two crucial features, apart from reducing running costs, also dramatically lower installation costs as smaller cables and MCB’s (Fuses) can be used.
An ECO UPS should always have a IGBT input stage and as a benefit of this, reflected electrical noise back to the utility supply should be less than three percent (<3%), this low reflected distortion results in electronic equipment up stream from the UPS being much less susceptible to interference (ideal for hospitals).
Another important consideration, with regard to THD is that most European countries are looking at imposing penalties on companies that excessively pollute the electrical grid, distortion levels should be low from any reputable ECO UPS and as such should not fall foul to these proposed financial penalties.
A secondary but very important feature of a quality ECO UPS is when considering using a generator to support your UPS, because reflected distortion is so low a substantially smaller engine and alternator can be used. Typically when calculating the size of a generator to run with a none ECO UPS a factor of 2.5 would be applied, example, a standard 100kVA UPS would require a 250kVA generator, the same 100kVA requirement but with ECO UPS features would only require a 120kVA set, a factor of 1.2, this is 52% smaller and offers profound ecological and financial benefits.
—————-
So we can conclude that:
1. Approaching a unity power factor is ideal mainly due to the capital cost savings in conductor sizes needed and in the resistive heating losses wasted in the power distribution network. We still want to be good for the planet, even if the utility bills us for W rather than VA — but I expect they bill for VA.
2. Power Factor has little to do with UPS conversion efficiency, which is somewhat described in the Wikipedia article.
On 4/17/2010 11:52 AM, Alan Crosswell wrote:
See page 14 of the HP article "Power Basics for IT Professionals" linked from the bottom ofhttps://wiki.cc.columbia.edu/greendc:start#literature_review
See the new ECAR study on Green IT in Higher Education
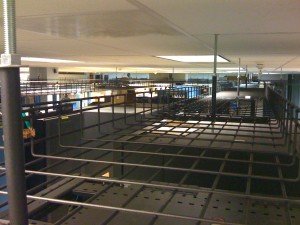
overhead cable tray
Installation of new overhead cable trays has commenced. We took the opportunity of a new SAN purchase to start moving our cables from under our 12″ raised floor to overhead. This will eventually allow us to reduce underflow blockages which impede airflow from our CRACs.
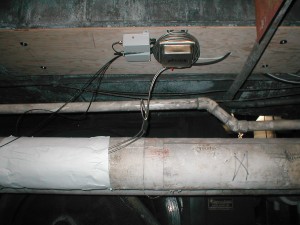
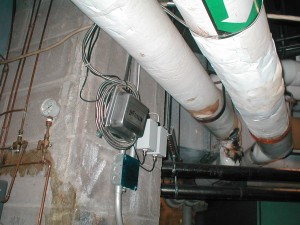
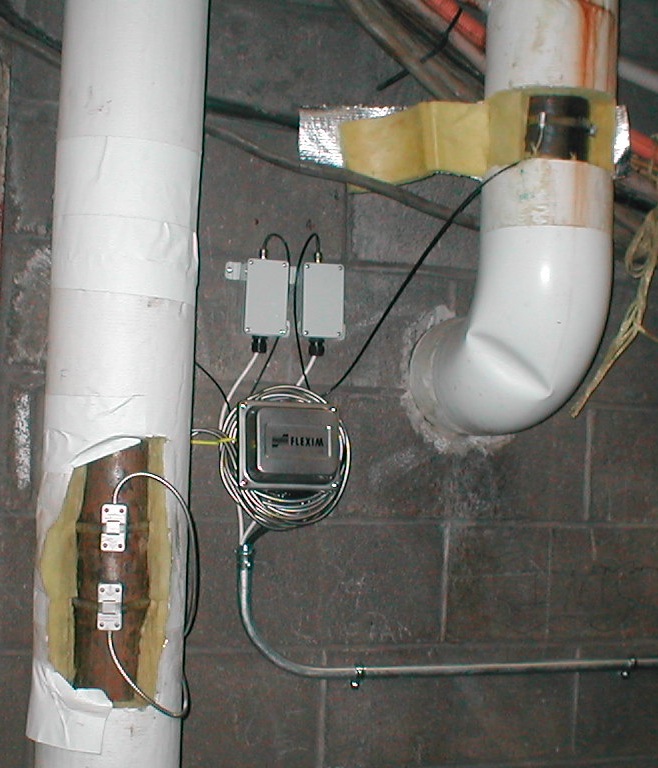
CUIT with the assistance of CUF, Thermosystems, and Flexim has completed the installation of Flexim UltraSonic Flow Meters for the application of metering the chilled water supply and return in order to track the heat load of the data center. Three measurement points were chosen to cover the heat load being rejected by AC units 1 & 2,
Liebert Units 1-6, and the dry coolers when they are operational.
Initial readings show the heat rejection of AC 1&2 and Lieberts 1-6 to be around 100 tons total which is in line with the rated capacity of these units.
I’ll be participating in a panel discussion entitled Assessing Performance – Metrics, Energy Use, and Useful Work from your Data Center at the Datacenter Dynamics conference on March 3, 2010.
The DOE has issued some clarifications about how to measure PUE as the original definition turned out to be too difficult for most data center managers to measure accurately.
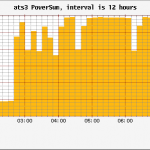
We ran fully on internal mechanical systems last week due to a scheduled central chilled water plant shutdown. See how ATS3’s electrical load jumped up around midnight.


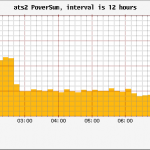
What’s really strange is the correlated dip in ATS2 and jump for ATS3 on Tuesday. The dip is about 5 kW (which we think indicates the external free cooling air being turned off) which corresponds to a 15 kW increase in load on the compressors. Makes sense but we need to understand what prompted the external cold air fans to be turned off — maybe it got too cold? The control systems are not linked among the CRACS and AHUs.
Now that the electrical metering is in place, we have some early graphs of power use over time:

PUE = Total Facility Load / IT Load
PUE (w/o chw) = 425 / 290 = 1.465 (too good to be true!)
NOTE: Need power from chiller plant to get PUE (w/chw), but the numbers we have make it seem like our efficiency is not that bad. 290kW is the power after the UPS’s. We need to do some further research to figure out how much power is lost to the plug of the servers themselves.
If we do a rpugh calculation assuming the Avg Power Factor on most of our rack mounted UPS’s is 0.8 then (290 * 0.8 = 232)
PUE (winter w/o chw) = 425 / 232 = 1.832 (probably closer to reality, but this is the winter)
Columbia project team members will be participating in the NSF-sponsored workshop on High Performance Computing Center Sustainability May 3-5 at Cornell Univeristy.
The IBM/Syracuse University Green Data Center was the subject of a full page ad in last weeks’ NY Times.

Wattnodes for all power panels in CC 200 have been installed and data
is being collected by Nagios and Cricket.
The DC Pro tools have been updated to include evaluation of air handling and electrical distribution and have lots of good documentation and examples.
See: http://www1.eere.energy.gov/industry/saveenergynow/dc_pro.html
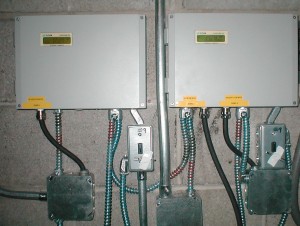
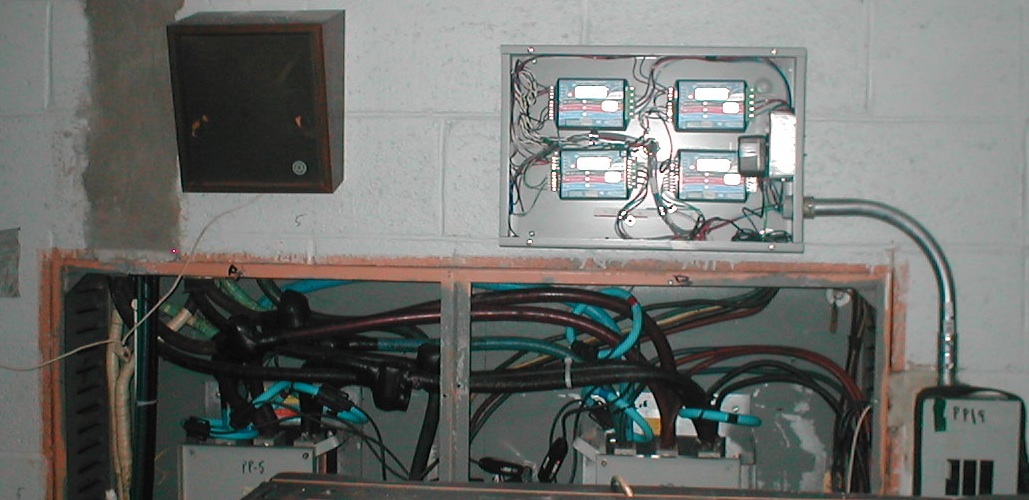
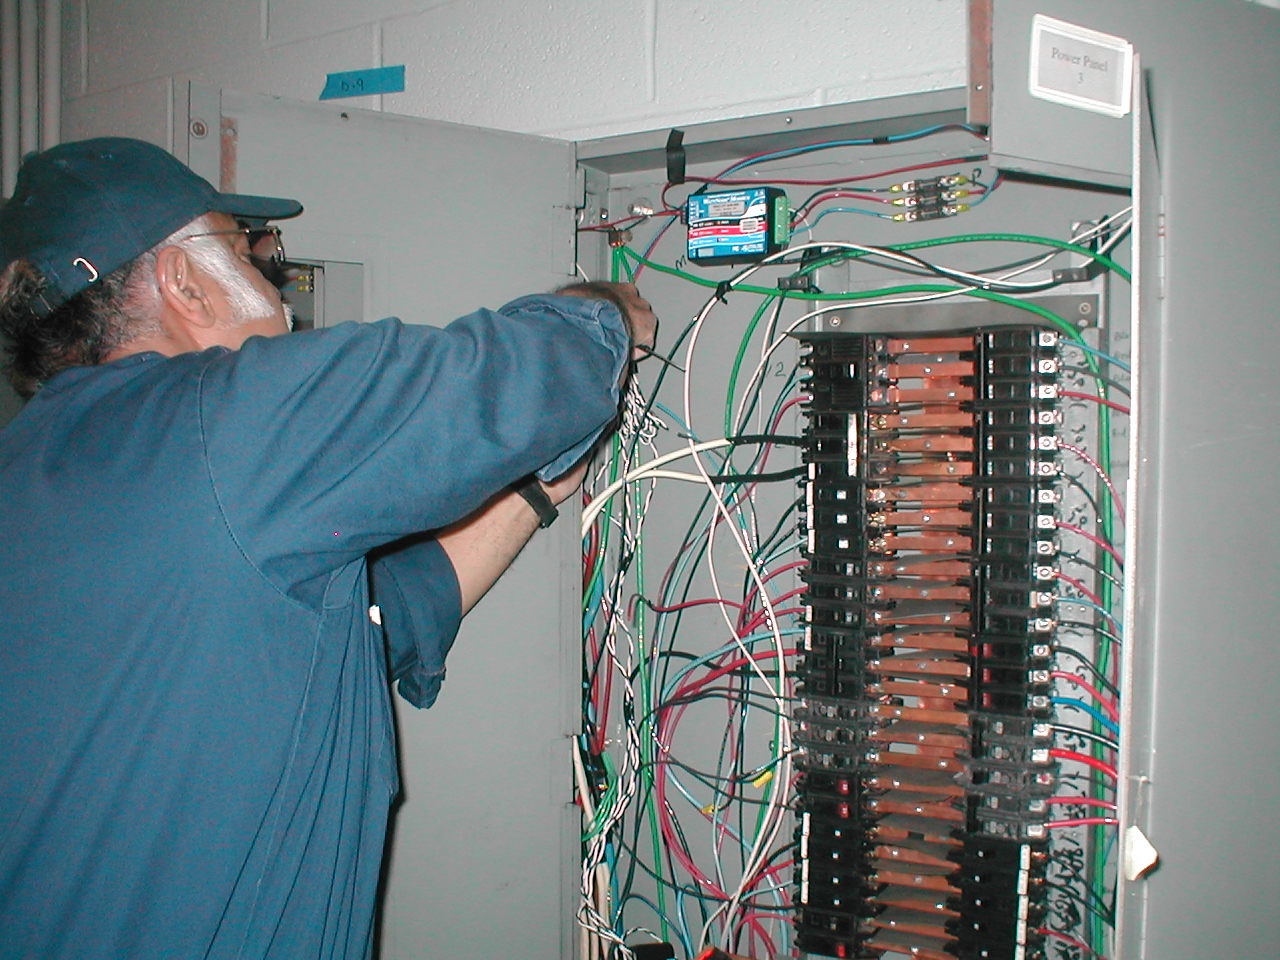
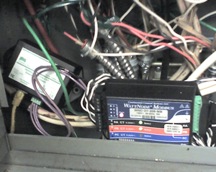 The first Wattnode was installed in Power Panel 2 and connected to a Babel Buster SPX for conversion of MODBUS to SNMP. This device will be tested and installed in all power panels in our Data Center.
Installation will be organized in 4 stages:
Green Data Center Webcast by Julius Neudorfer of NAAT
http://whitepapers.businessweek.com/detail/RES/1243954119_914.html
The Raritan PDU will allow metering power usage of old servers via SNMP.

CUIT selected the Raritan PDU device to monitor server electrical usage
2. Use SNMP to track power usage
… IT managers can turn on SNMP polling across various devices, such as light systems, and monitor power usage and thermostat levels without investing in power monitoring tools….
See: http://www.thestandard.com/news/2009/04/02/diy-tips-how-cut-costs-and-get-more-your-it-gear
See http://sicortex.com/green_index
On the GCPI page, you’ll see the HP BL2x220C comes in 4th place, after SiCortex, SGI and IBM Blue Gene/P. The SGI appears to be Intel architecture (Xeon X5472) while the others ahead of the HP are special purpose — SiCortex Ice9, PowerPC 450.
CUIT may plan on running the HPCC benchmark suite(s) cited. See http://icl.cs.utk.edu/hpcc/
The New York State Energy Research and Development Authority (NYSERDA) Advanced Concept Data Center Pilot project will implement selected improvements in the University’s Morningside Data Center while also providing rigorous before-and-after-measurements to assure achievement of anticipated energy savings. NYSERDA has awarded the University a grant which, when matched with University funds, will finance the project. The project is closely aligned with the University’s financial, IT, E-Science and environmental sustainability goals.
The NYSERDA project will focus on updating the Data Center’s aging infrastructure design and support of High Density Computing (HDC). Specifically, it will address the electrical distribution systems to increase efficiency due to transmission losses and other areas. The project will also concentrate on sub-standard cooling practices, which are wasting cooling capacity and energy and utilization of out-of-date servers.
The proposed HP solution of a blade center chassis c7000 with 16 BL2x220C blades (32 dual-quad core servers) takes 50% of the space and consumes 30% less power than comparable manufacturer’s products.