Plotting Circles on a Map (with Leaflet, converting .csv to JSON array)

Suppose you have a list of places and you’d like to plot them on an interactive map.  The example below uses locations in Delhi, India.

Input:
SHALIMARBAGH DELHI, NARELA DELHI, KANJHAWALA DELHI, BAWANA, KASHMIRI GATE, NARAINA GOPINATH BAZAAR

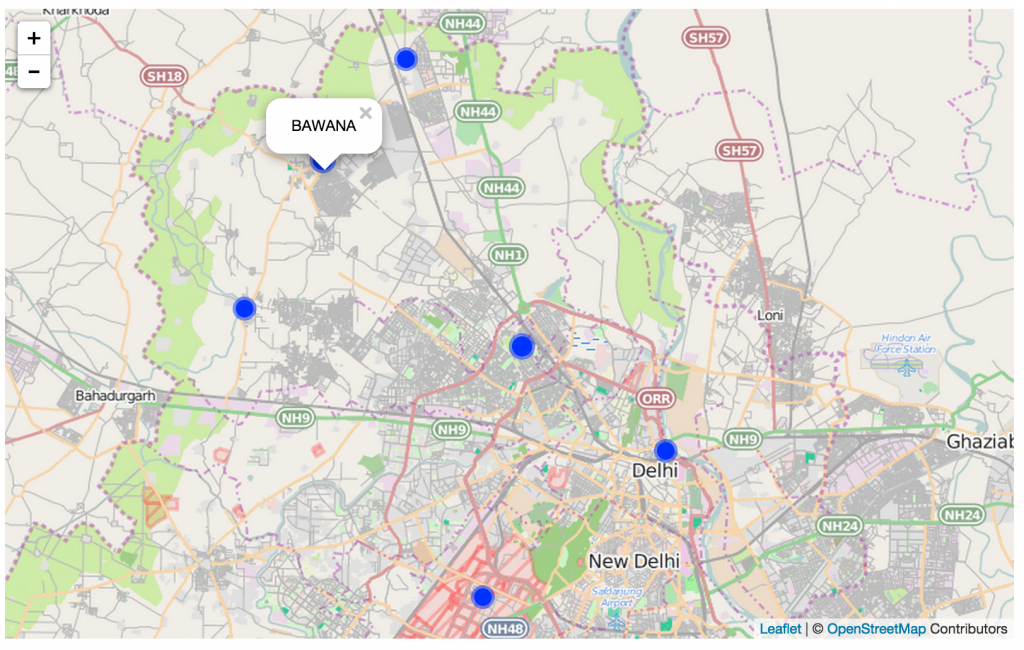
What we’re aiming for:
Plotting Points on Map of Delhi

The following guide uses code from the following tutorials:

  • http://leafletjs.com/examples/quick-start.html
  • http://www.d3noob.org/2014/02/adding-multiple-markers-to-leafletjs-map.html

1. Get corresponding latitude and longitude coordinates.
http://www.findlatitudeandlongitude.com/batch-geocode/

“original address”,latitude,longitude
“SHALIMARBAGH DELHI”,28.716413,77.154585
“NARELA DELHI”,28.85396,77.091784
“KANJHAWALA DELHI”,28.734729,77.004176
“BAWANA”,28.805465,77.046301
“KASHMIRI GATE”,28.666472,77.233289
“NARAINA GOPINATH BAZAAR”,28.596289,77.133865

2. Convert CSV (comma-separated values) output to JSON array
http://www.convertcsv.com/csv-to-json.htm

[
[“SHALIMARBAGH DELHI”,28.716413,77.154585 ],
[“NARELA DELHI”,28.85396,77.091784 ],
[“KANJHAWALA DELHI”,28.734729,77.004176 ],
[“BAWANA”,28.805465,77.046301 ],
[“KASHMIRI GATE”,28.666472,77.233289 ],
[“NARAINA GOPINATH BAZAAR”,28.596289,77.133865 ]
]

3. Copy-paste coordinates into existing template.
Code and map can be found on Plunker:
http://embed.plnkr.co/5gh2mknjC51C6BmdsFwo/preview

<!DOCTYPE html>
<html>
<head>
<title>Plotting Circles on a Map</title>
<meta charset=”utf-8″ />

<meta name=”viewport” content=”width=device-width, initial-scale=1.0″>

<link rel=”stylesheet” href=”http://cdn.leafletjs.com/leaflet-0.7.3/leaflet.css” />
</head>
<body>
<div id=”map” style=”width: 800px; height: 500px”></div>

<script src=”http://cdn.leafletjs.com/leaflet-0.7.3/leaflet.js”></script>

<script>

//Set the map center and zoom level
var map = L.map(‘map’).setView([28.7271309, 77.1480638], 11);
mapLink =
‘<a href=”http://openstreetmap.org”>OpenStreetMap</a>’;
L.tileLayer(
‘http://{s}.tile.openstreetmap.org/{z}/{x}/{y}.png’, {
attribution: ‘&copy; ‘ + mapLink + ‘ Contributors’,
maxZoom: 18,
}).addTo(map);

//Add coordinates here
var planes1 = [
[“SHALIMARBAGH DELHI”,28.716413,77.154585 ],
[“NARELA DELHI”,28.85396,77.091784 ],
[“KANJHAWALA DELHI”,28.734729,77.004176 ],
[“BAWANA”,28.805465,77.046301 ],
[“KASHMIRI GATE”,28.666472,77.233289 ],
[“NARAINA GOPINATH BAZAAR”,28.596289,77.133865 ]
];

//Change the size and color of circular markers here
for (var i = 0; i < planes1.length; i++) {
circle = new L.circle([planes1[i][1],planes1[i][2]], 500, {
fillOpacity: 1.0
})
.bindPopup(planes1[i][0])
.addTo(map);
}

</script>
</body>
</html>


More Women in Computer Science

“In the United States in 2009, women earned 52% of all math and science degrees but only 18% of technology-related degrees. What’s up with that?”

Our Data Visualization instructor shared this video from she++ that addresses the issue of why there aren’t more women going into the field of computer science.

[vimeo]http://vimeo.com/63877454[/vimeo]

There is a growing demand for computer scientists  but women are underrepresented in tech-related careers.

“By 2020 U.S. businesses will need  1.4 million computer scientists.  At today’s graduation rate only 30% of those jobs will be filled by American-trained computer scientists.”

The women (and men) interviewed in this video advise aspiring female programmers and software engineers to have the courage to try new things, to not be intimidated, and to “fake it until you make it.”

In order to narrow the large gender gap in these fields, girls need to be given exposure to programming and computer science as early as possible.  While there is still a lot of work to be done, it is encouraging to see organizations such as she++ and Girls Who Code working to grow and develop the next generation of women in technology.


On the Correct Interpretation of Confidence Intervals

“What is the correct interpretation of a 95% confidence interval (CI)?”

This was a question posed to students by a professor in an upper-level graduate statistics course. As expected (or perhaps surprisingly), some of the answers that students gave were not quite the ones he was looking for.

For example, let’s say we want to know the true average number of dates that Master’s students at Columbia University have been on in the past year. (Of course, we’d have to define what we mean by “date” but I’m sure there are tons of blog posts on the subject of “Does this count as a date?”)

Since it would be impractical to grab every graduate student at Columbia and ask them to (truthfully) report the number of dates they’ve been on, we can instead take a random sample of students and try to infer from this sample what the true mean is.

So, suppose we got a random sample of 100 Columbia graduate students and found that the average number of dates they went on in the past year was 7.6. The calculated 95% confidence interval was (4.4, 12.0). What is the correct interpretation of this confidence interval?

Let’s start with the incorrect interpretation that one might be tempted to give, which is that there is a 95% chance that the true mean is within this interval. Again, this is not the right interpretation. The true mean is either within or outside the confidence interval. The chances are 0% or 100%.

What the 95% CI does mean is that, if we repeatedly sampled 100 students from Columbia, and found the means and calculated the corresponding confidence intervals, we would expect the true mean to be within these CIs 95% of the time.

I’m aware that there are many sources out there explaining the answer to this question (“what is the correct interpretation of confidence intervals?”), but I thought it was worth repeating as it seems to come up in every statistics class. But the answers aren’t always right every time.

If you’re thinking, “My statistics professor might be satisfied with the ‘correct’ interpretation but how do I explain confidence intervals to people without any background in statistics?”

I’ll be addressing that in a future post, so check back soon!

On Grit and Perseverance

“…achievement is the product of talent and effort.” (Duckworth et al., 2007)

In this TED Talk, Angela Duckworth speaks about her experience as a teacher and what differentiated the best and worst students in her seventh grade math class. She found that the students with the highest grades weren’t necessarily the ones with the highest I.Q.

In fact, she studied individuals in a variety of situations—from cadets at West Point Military Academy to competitors in the National Spelling Bee—and discovered again that the most successful individuals were not the ones with the greatest social intelligence, physical aptitude, or I.Q.

Instead, the most significant predictor of success in her studies was grit, a “passion and perseverance for very long-term goals.” One of the ways to build grit is to have a growth mindset, which is the belief that the ability to learn can be changed with effort. So when you hit a hard problem, don’t stop: keep trying, practice, and don’t be afraid to ask for help.

Here’s the full video on grit, growth, and greatness:
[youtube]https://www.youtube.com/watch?v=H14bBuluwB8[/youtube]

Duckworth, A. L., Peterson, C., Matthews, M. D., & Kelly, D. R. (2007). Grit: perseverance and passion for long-term goals. Journal of personality and social psychology, 92(6), 1087.