
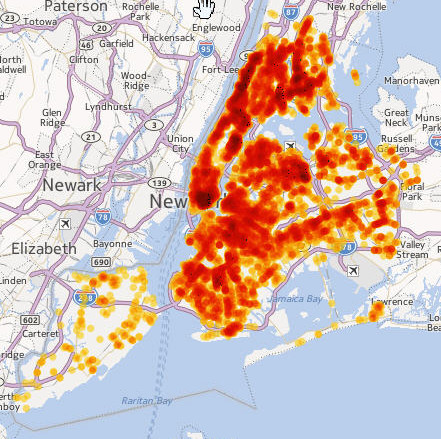
I have started working with CartoDB a web based GIS tool that allows you to map and animate spatial data. I downloaded reports of graffiti over the last several years from the NYC open.gov data site and was able to create this map showing the density of reports across NYC; darker red colors indicate more reports. CartoDB can also create animations of time sequence data.
 One issue I ran into was that most of the NYC data uses the State Plane Coordinate system for point data while CartoDB and most other GIS tools require Longitude and Latitude data. I found a program called Corpscon6 from the US Army Corps of Engineers that batch converts State Plan Coordinate data to Long and Lat data. NYC usually uses the NAD83-feet format and you want to set the zone to “3104 – New York State Long Island”.
Most implementations of WordPress won’t let you embed the CartoDB maps and animations, so you will need to click out of my blog to see it (click here).
