
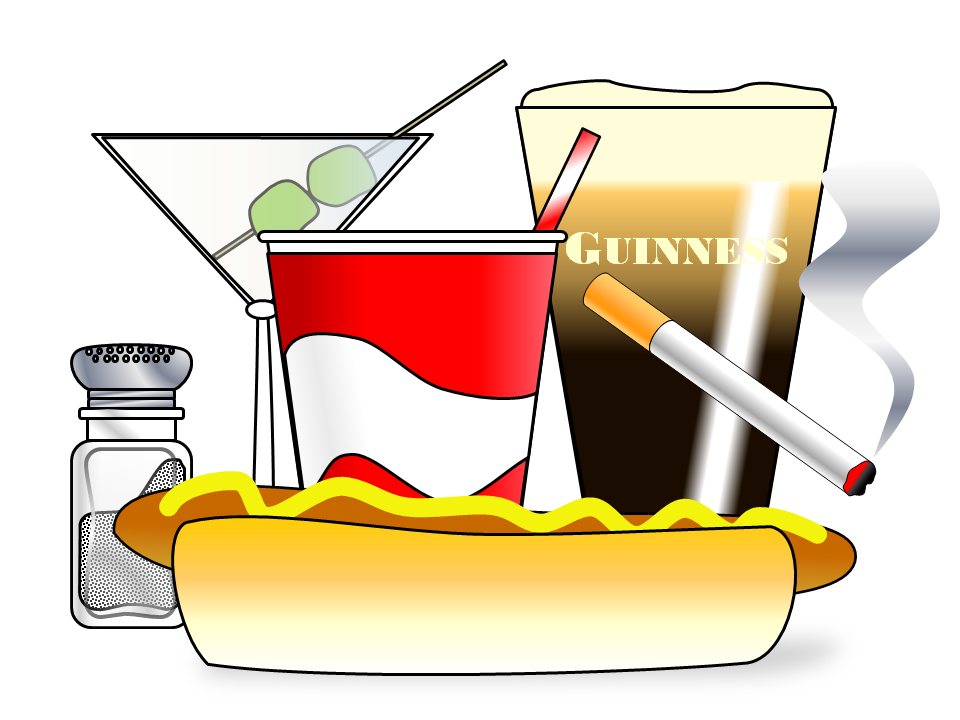
I have written previously about the value of including graphics in publications, here I show some ways to create your own graphics. PowerPoint provides some solid vector graphics tools that can be used to create illustrations. The image below was created entirely in PowerPoint using the Shape, Edit Shape –> Edit Points and the Shape Fill Gradient tools.
 Each of the elements in this illustration was made using the Shape tool and then editing the line segment control points. I began by using shapes vaguely close to what I would
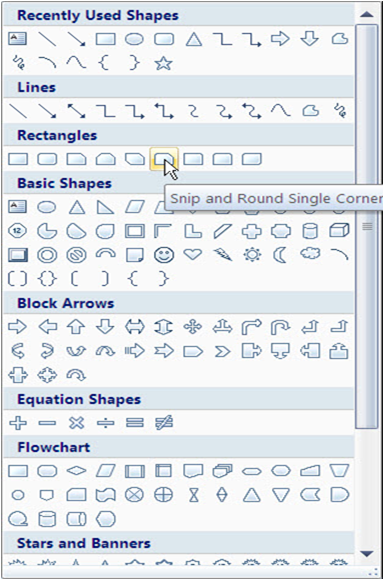
Insert Shape menu
like the final shape to look like. Then I used the Edit Shape –> Edit Points tool which reveals the control points that determine the structure of the shape. The Edit Points tool allows you to move the control points, alter the angle of the line heading into and out of a control point, turn straight lines into curves and curves to straight lines and add and subtract control points.
The hot dog bun began as a trapezoid. To get the rounded shape I wanted, I used the Edit Shape –> Edit Points tool to convert each of the corners to a rounded corner and used the control point handles tool to alter the steepness of the curves entering and leaving each control point. I also added a couple of additional control points at the top and bottom to add in some additional rounding along the top and bottom of the bun. I then used the Shape Fill Gradient tool to color and shade the bun. The shadow below the bun was created using the Shape Drop Shadow tool.
The image below shows a line with the control points and control point handles. These elements become visible when you click on the shape and then click the Edit Shapes –> Edit Points tool. The black squares are the line control points and the white squares are the control handles for one of the control points. The control points allow you to position the corners along the length of the line or the apexes of the curves along the line. Moving the control handles alters the steepness and curve of the line segment going into and out of the control point. These handles allow you to alter the shape of the curve.
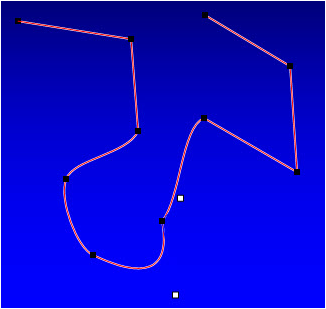
A line with control points (black points) and control handles (white squares) made visible using the Edit Shapes –> Edit Points tool.
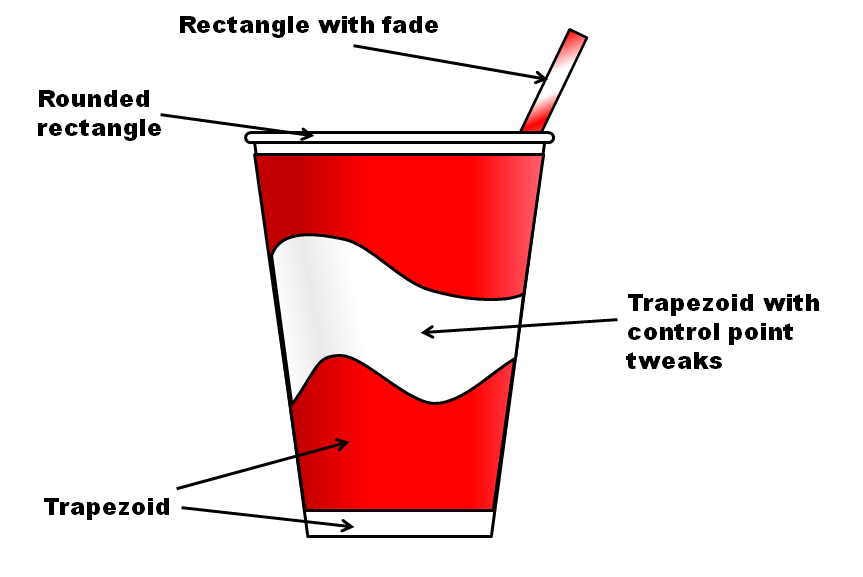
The image below shows the soda cup with the component parts labelled. The main body of cup is made of three trapezoids layered on top of each other. The bottom layer is a white trapezoid on top of which I layered the red trapezoid. I used the Fill Gradient tool to shade trapezoid and give it a rounded feel. The white “Pepsi” wave is a trapezoid to which I added control points to create the curves, this trapezoid is the top of the stack of layered shapes. There is a slight Fill Gradient on the swirl to create some shading on the wave. The lip of the cup is a rounded rectangle and the straw is a rectangle. The stripes on the straw were created using the Fill Gradient tool.
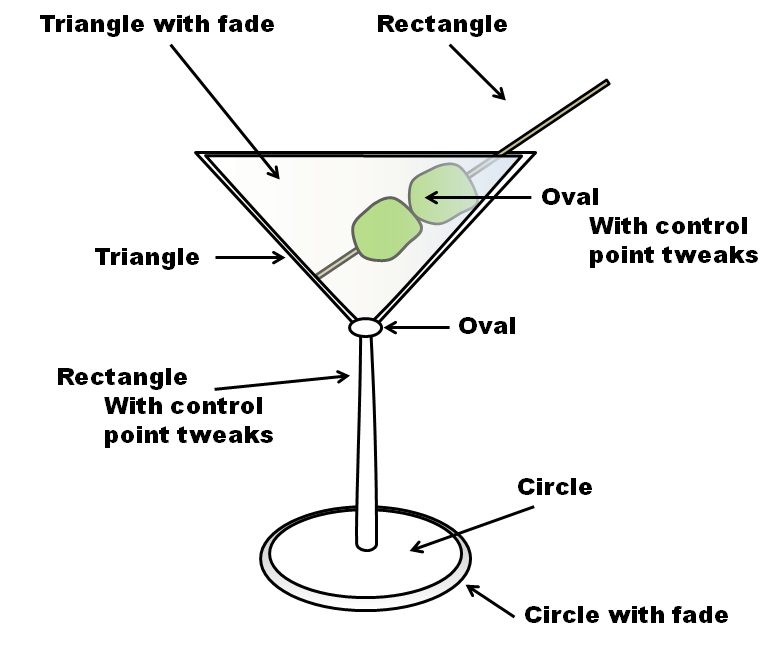
 Below is an image of the martini glass with it’s component parts labelled. The main trick in creating the martini glass was using the Bring to Front/Send to Back tools to layer a series of shapes. The glass uses a Gradient Fill and Transparency to create shading.

See the attached web link for examples of just how far one can push PPt illustration capability. I’ve had college-level PPt instructors tell me, “You can’t DO that with PPt!”
I use PPt 2003 exclusively.