Visualization Work of Albert Boulanger
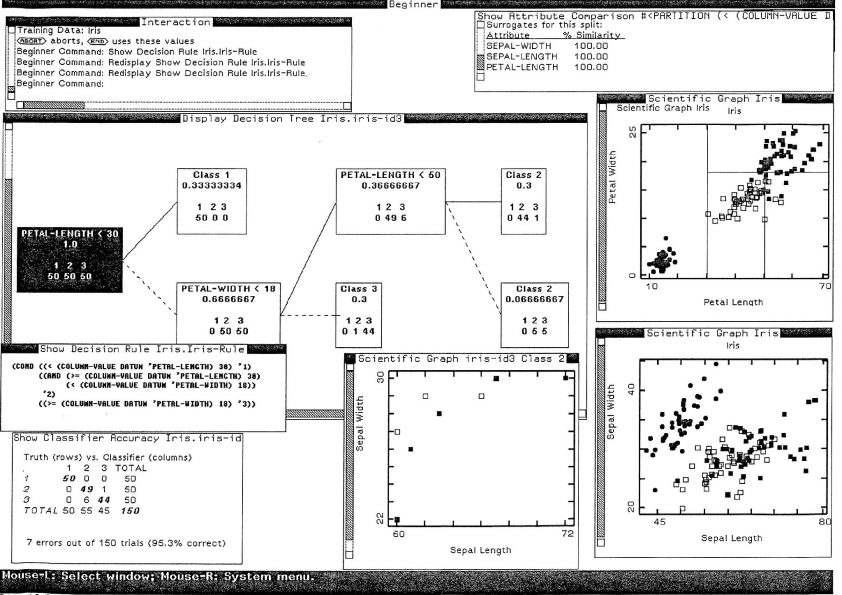
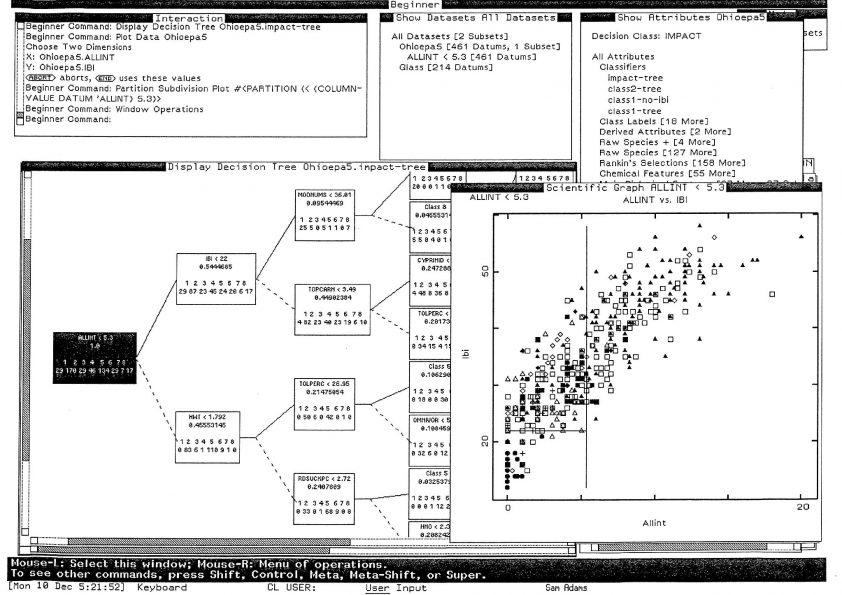
I am an advocate of always visualizing data and models and have worked on tools to support great visualizations as part of the data analysis and modeling from building 3D immersive visualizations to exploratory data analysis visualizations closely integrated with machine learning model visualization. The pictures below illustrates how the Beginner machine learning framework I helped develop at BBN visualized decision tree models as rules, decisions trees, and the decision boundaries projected into the data visualization.
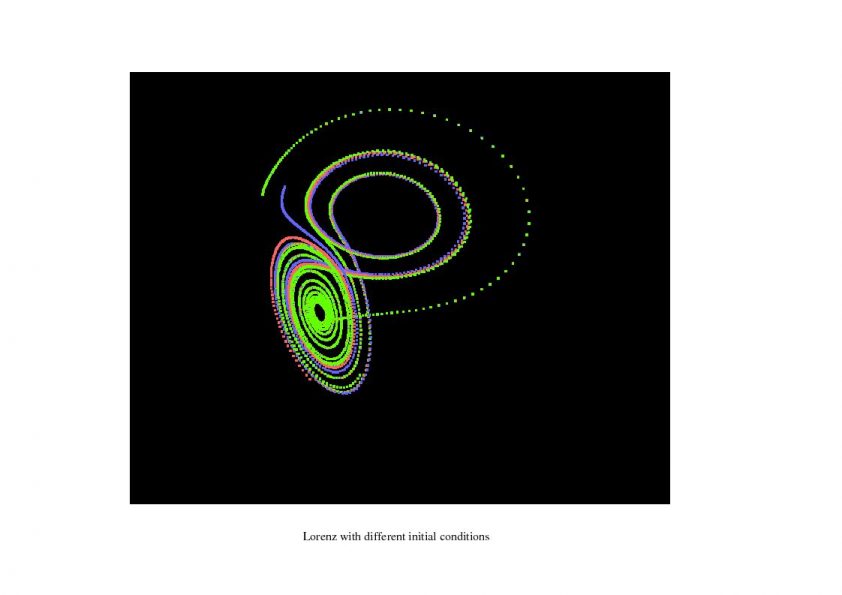
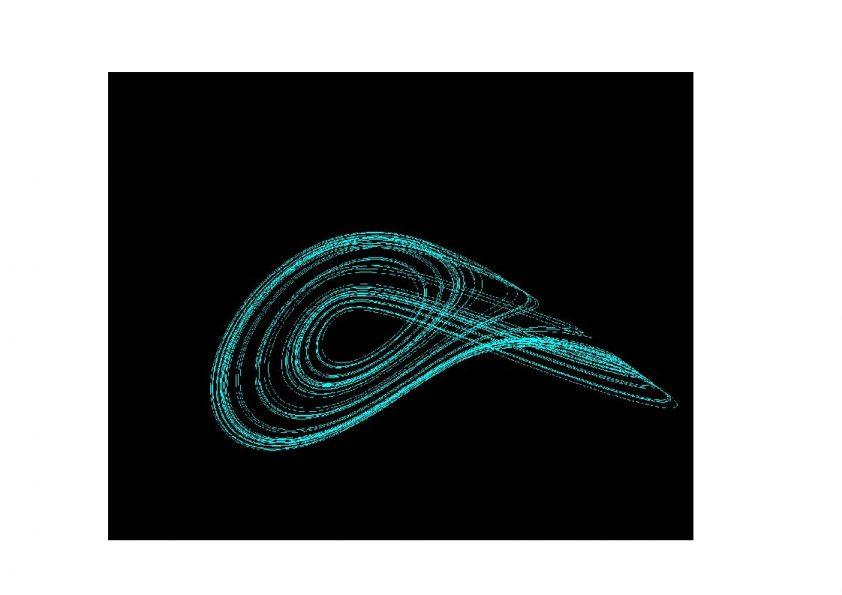
Here is some work I did on video feedback at Bolt Beranek and Newman for this NSF program and also this paper: Feurzeig W., Horwitz P., Boulanger A. (1989) Advanced Mathematics from an Elementary Viewpoint: Chaos, Fractal Geometry, and Nonlinear Systems. In: Kaltofen E., Watt S.M. (eds) Computers and Mathematics. Springer, New York, NY https://doi.org/10.1007/978-1-4613-9647-5_28. I also did development of an application to interact with chaotic attractors. Here are some images from that application.
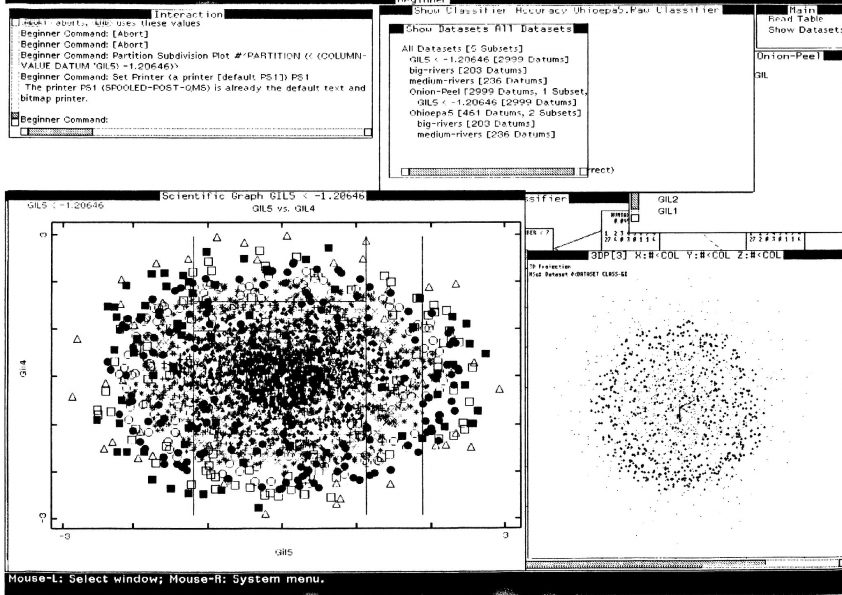
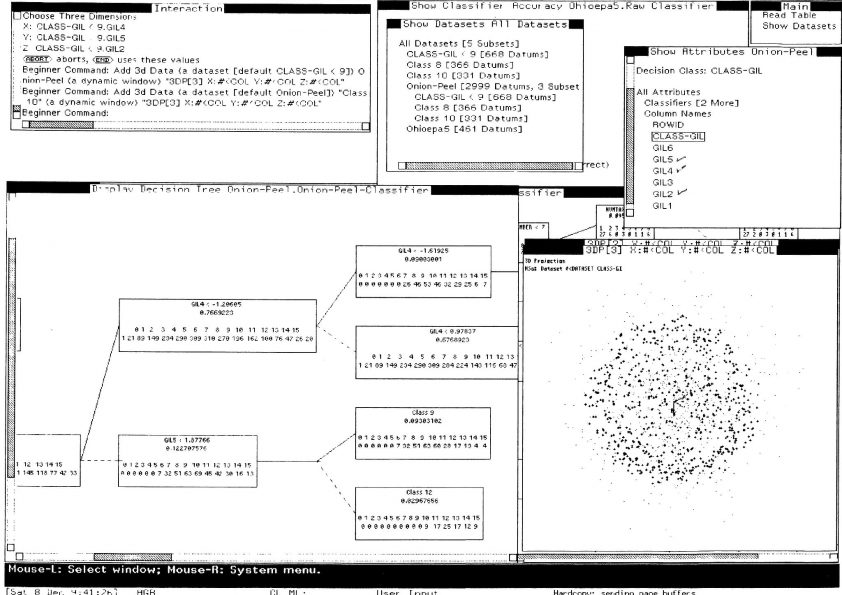
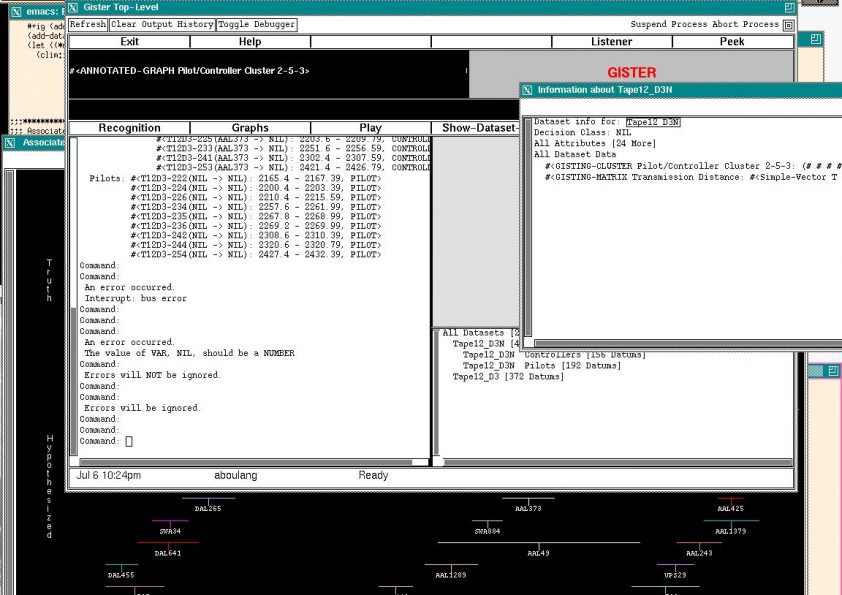
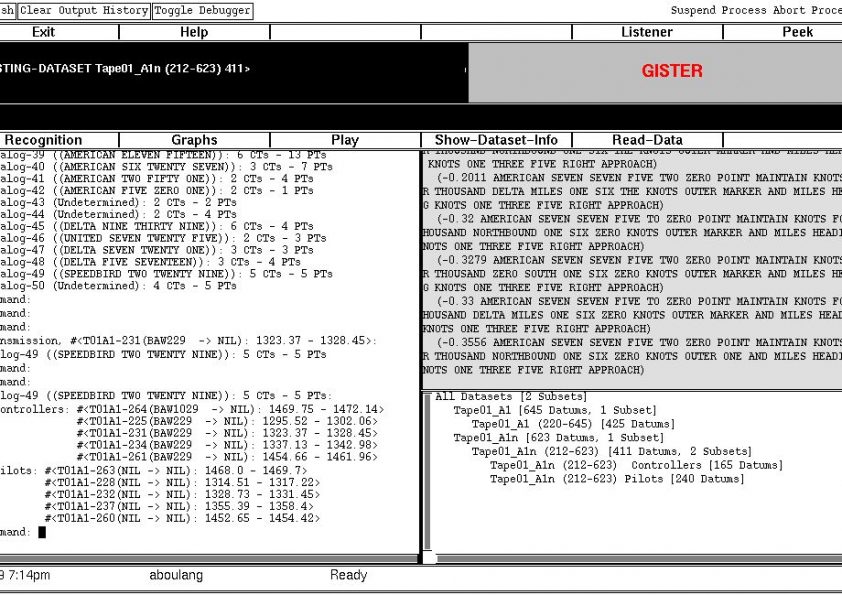
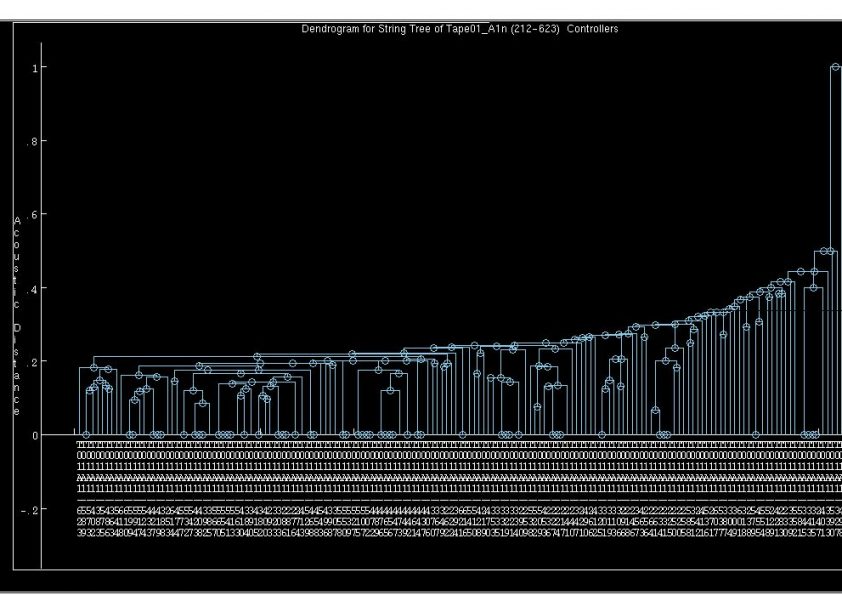
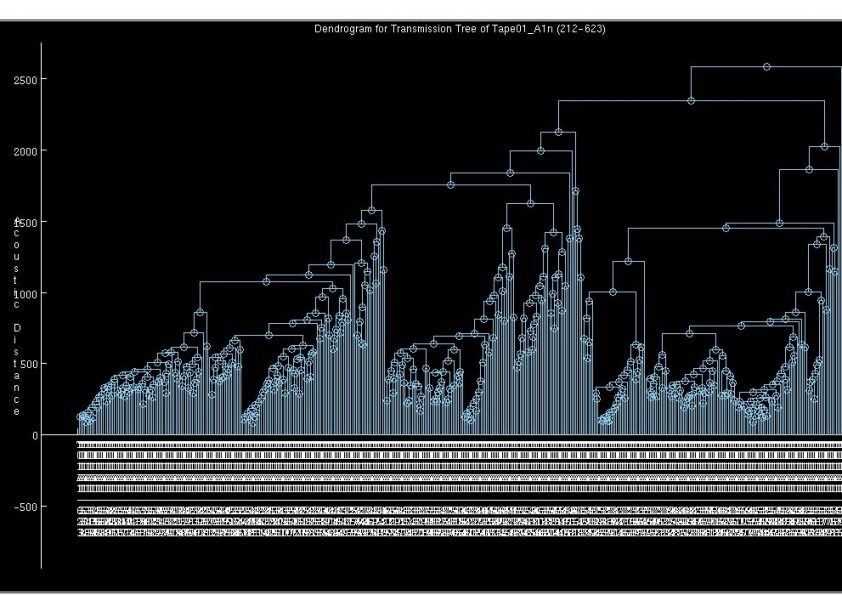
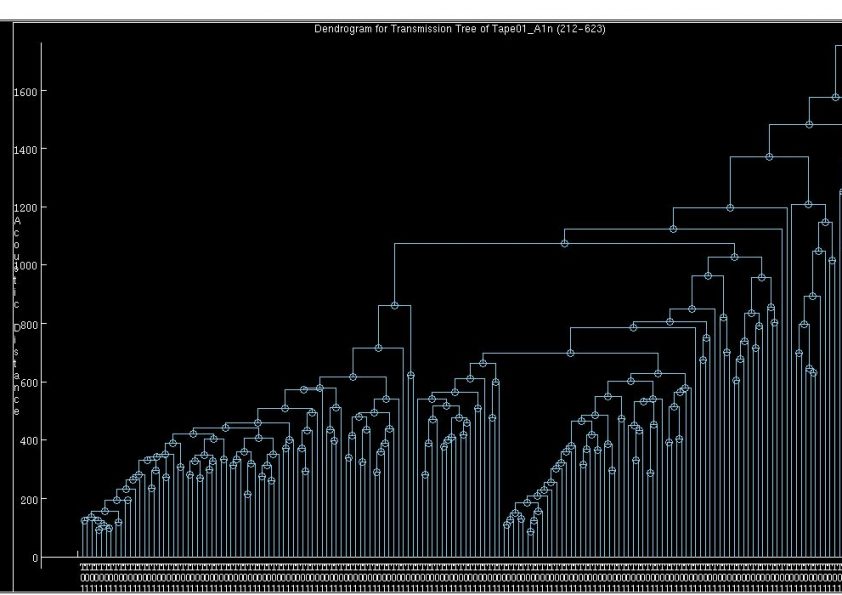
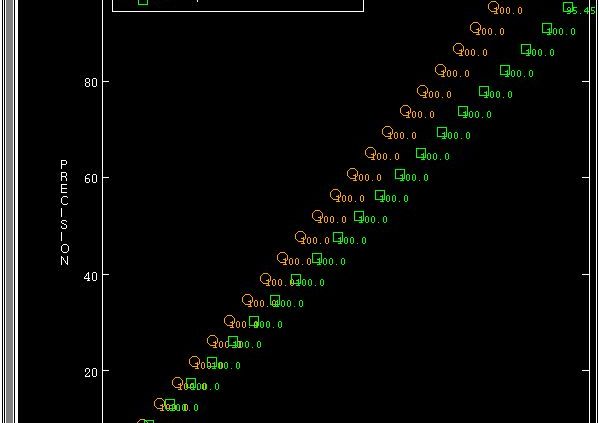
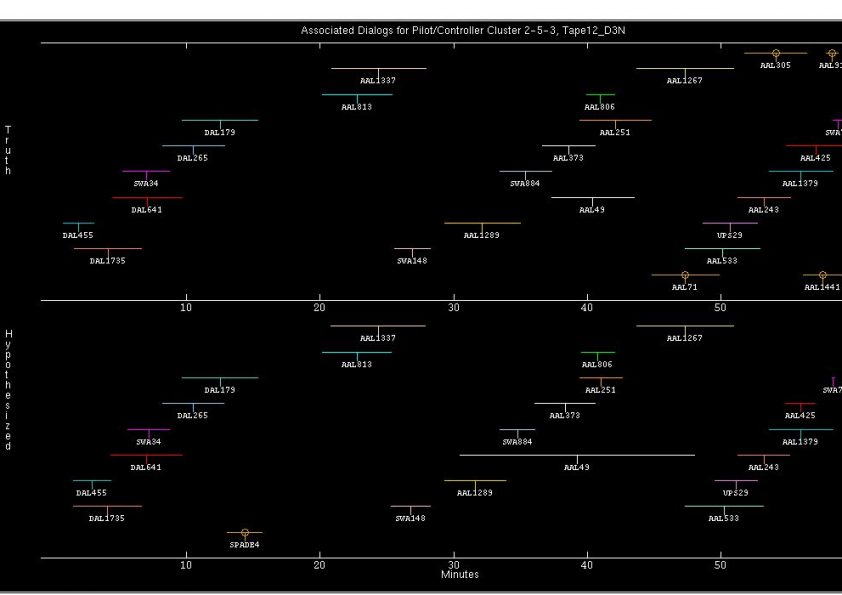
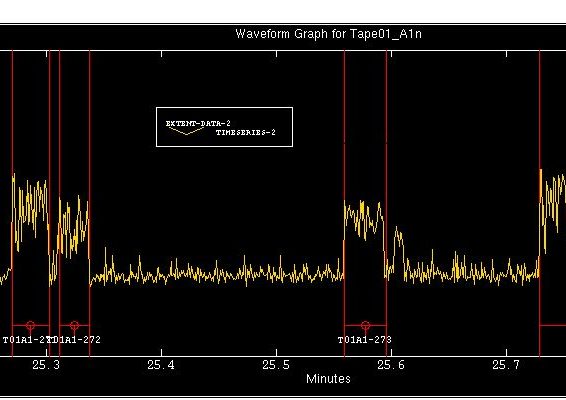
I also built the user interface, did algorithm development and made some custom graphs for the Gisting Conversational Speech Project at BBN. The research is described in this paper: J. R. Rohlicek, D. Ayuso, M. Bates, R. Bobrow, A. Boulanger, H. Gish, P. Jeanrenaud, M. Meteer, and M. Siu, “Gisting conversational speech,” in Acoustics, Speech, and Signal Processing, 1992. ICASSP-92., 1992 IEEE International Conference on, 1992, vol. 2, pp. 113–116 https://doi.org/10.1109/ICASSP.1992.226107.
Oil and Gas Reservoir 4D Visualization
3D VRML Models (you can use the Cortona3D plugin to view). Get a VRML viewer plugin here. I am working on converting these to X3D to display in modern browsers w/o a plugin.
Here are some videos of the models
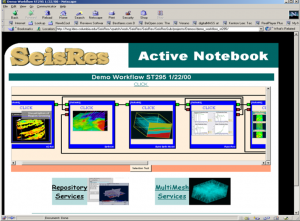
4D seismic cube for ST295
Movie of a 3D VRML model of 4D seismic analysis for ST29.
Visualizations for Portfolio Management of Oil and Gas fields,
Principle Component Analysis and Visualization of Oil and Gas Companies.
Here are some paper and slide presentations with visualizations I have worked on.
- Technologies and Portfolio Management in the Business Side of E&P March 1999 Talk. Includes PC analysis.
- Rice University Conference on Emerging Energy Technologies, November 1998 Presentation by Roger Anderson, 4D Reservoir Management in the Oil Industry
- Roger Anderson & John Howell’s Talk at the 1999 SPE Hydrocarbon Economics and Evaluation Symposium — Implementing Portfolio Management: Issues, Insights, and Answers?
- Albert Boulanger (unpublished) Statistical Analysis of Lamont 4D Methodology
- Roger N. Anderson Technical innovation: An E&P business perspective, The Leading Edge June 2000
- Roger N. Anderson, SPE, Albert Boulanger, Lamont-Doherty Earth Observatory, Columbia University, NY, and John I. Howell III, Portfolio Decisions, Inc. Houston, Tx The Economics of 4D Reservoir Management, OTC 2000
- Roger Anderson and Albert Boulanger, Quantitative Tools Link Portfolio Management with Use of Technology Oil & Gas Journal, November 30, 1998
Suitability Matrix Visualization
A 3-D rendering of a suitability matrix which is part of our lean energy management methodology covered in our book: Computer-Aided Lean Management for the Energy Industry.
At vPatch, I worked on bringing our technologies into portals. Here is a demonstration of the Suitability Matrix in a demo portal.


Recent Comments