
 There are many useful—and beautiful—data visualization sets in tech. Let me introduce you to some.
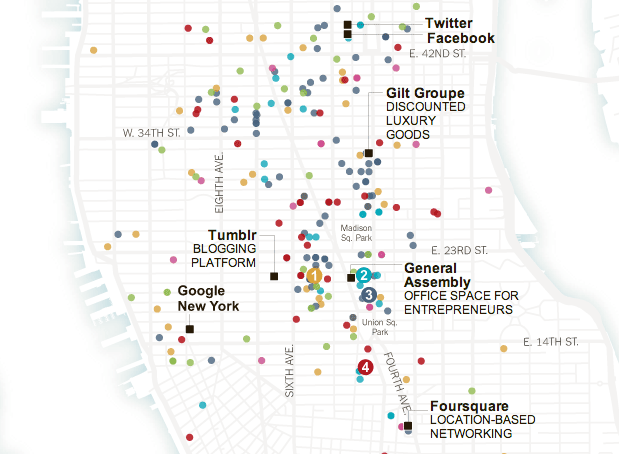
1. “Technology Footprint: Starting Up in New York” by The New York Times
Have you ever wondered where the tech hot zones are in Manhattan? Did you know that Twitter, Facebook and Google all have headquarters in the Big Apple? In November of last year, the New York Times published this handy map of Silicon Alley—the city’s answer to Silicon Valley in the Bay Area. The push for New York to be a new hotbed for incubating startups is still in full swing, and apart from the big names, you can see where nascent tech companies are setting up shop.
2. “Envisioning Emerging Technology for 2012 and Beyond” by Envisioning Tech
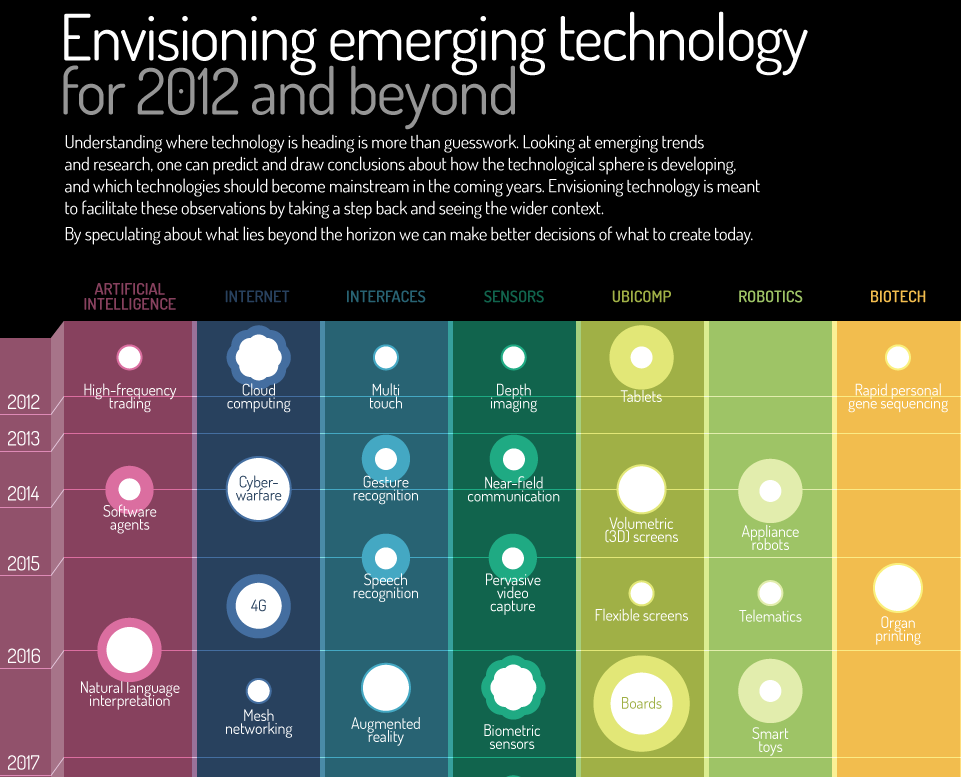
This beautiful infographic highlights what we can expect to be the significant strides in innovation from now until the year 2040. The graphic is separated into categories and includes fields such as artificial intelligence, sensors, robotics, materials, energy, space, and many more.
The project, compiled by Michell Zappa of the tech forecasting firm Envisioning Technologies, aims to help audiences get a visual sense of incoming innovations and take a long view to see their potential impact. The website version also provides an interactive experience, letting users point at an item to see a longer description of each development from the different fields. The potential impact of each technology is represented by the size of the nodes.
Here are some of the advancements Zappa predicts:
- 2018: Self-driving cars
- 2019: Space tourism
- 2026: Domestic robots
- 2033: Remote presence
- 2035: Human missions to Mars
3. “Mapping How Viral Photos Spread” by Stamen Design
Likes and comments are one thing, but they don’t track how a really great link is shared through the networked world of Facebook. Stamen Design, a design and technology studio based in San Francisco, recognized this, and came up with this stunning animation to show how a link can spread virally.
Hit play, and you’ll see how one source creates tendrils and winds around the space. There’s a quick eruption at the beginning, then the vines reach around and curl off into different groups. It’s absolutely mesmerizing.