——————————————————————
News update:
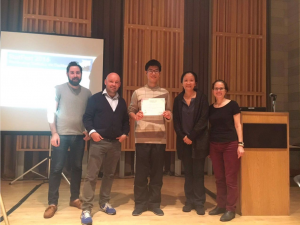
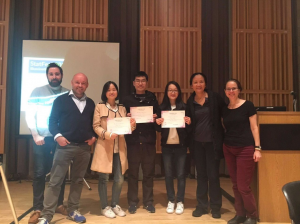
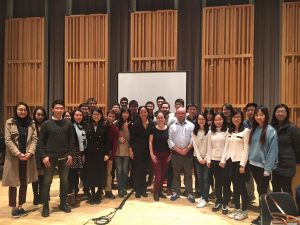
Thanks everyone for joining us and congrats to our two winning teams Sun and Tetris! Please subscribe our newsletter for future events.

Sun’s Team

Tetris’s Team
——————————————————————
DataFest Detail:
The theme of this Hackathon is to create dashboards for visualizing statistical concepts that is accessible to general public. Through the series of lectures and the Hackathon contest afterwards, you will get familiar with the R shiny apps in Rstudio. The idea is motivated by the works being done by http://www.stats.org/.
There will be two winning teams in the contest. Each team will be awarded with $250 gift card. Food & drinks are provided during the StatFest.
Topic: Illuminating Statistics via Dashboard

RSVP: RSVP LINK
When: 12th Nov. 9am – 9pm
When: 13th Nov. 9am – 5pm
Where : Lerner Hall Room555
Schedule :
Saturday (11/12) morning – 9:00-10:00: Registration and ice-breaking
– 10:30-11:00: Q&A
Saturday (11/12) afternoon
Sunday (11/13) morning
Dr. Trevor Butterworth, Sense about Science USA
Sunday (11/13) afternoon
– 3:00-4:00: Presentations
– 4:00-4:30: Judging

