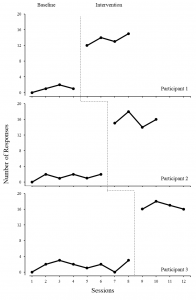
With this design, one can test the effects of a treatment across multiple entities (participants, settings, or behaviors) wherein each entity is probed for a baseline level of responding at least once prior to entering intervention and the start of intervention is staggered across participants, settings, or behaviors.
SCROLL DOWN TO LEARN MORE ABOUT THE DESIGN
Video Instruction
Need to know how to set up the instruction?
More Information about Multiple Baseline Designs
 A graph for a multiple baseline design consists of 2+ graph panels, each displaying data for one of the entities across which an intervention was tested (e.g. multiple participants with a single behavior, multiple settings with 1 participant, or multiple behaviors with 1 participant). All entities begin in a baseline phase for a given number of sessions, allowing the researcher to make a strong prediction about behavior in the absence of change. Then, the first entity is placed in intervention while the others remain in baseline. With the non-treated entities, if the experimenter observes no change in baseline responding, this provides evidence of verifying baseline predictions. After the first entity demonstrates sufficient change (e.g., mastery of a new skill), the experimenter places the second entity in intervention and repeats this process with the third entity. If the experimenter observers repeated change in behavior only after implementing the intervention, one can determine functional relations. Graphically, baseline and intervention conditions are separated by a staircase-like condition line across the panels.
Examples
Reilly Lawson and Greer (2006) used a multiple baseline design to evaluate a writer immersion program with 9th graders. The researchers observed systematic increase in functional (i.e., affecting the behavior of a reader) and structural components of writing as the intervention was applied to different students.
Maffei-Almodovar, Feliciano, Fienup, and Sturmey (2017) used a multiple baseline design to evaluate an intervention to teach graph analysis. Community teachers received a behavioral skills training intervention and each teacher increased her accuracy of applying data-based decision making.