
Diabetes Mortality by Zip Code Poverty Rate, NYC 2013
One of the goals of the Social Epidemiology Cluster, and this blog, is to make the case that social disparities are a critical determinant of health and well being. To propel this argument forward we are building a library of Info-Graphix that highlight the effect of social disparities on health. Slide decks on various topics will be available in PowerPoint format for download and are freely available for use.
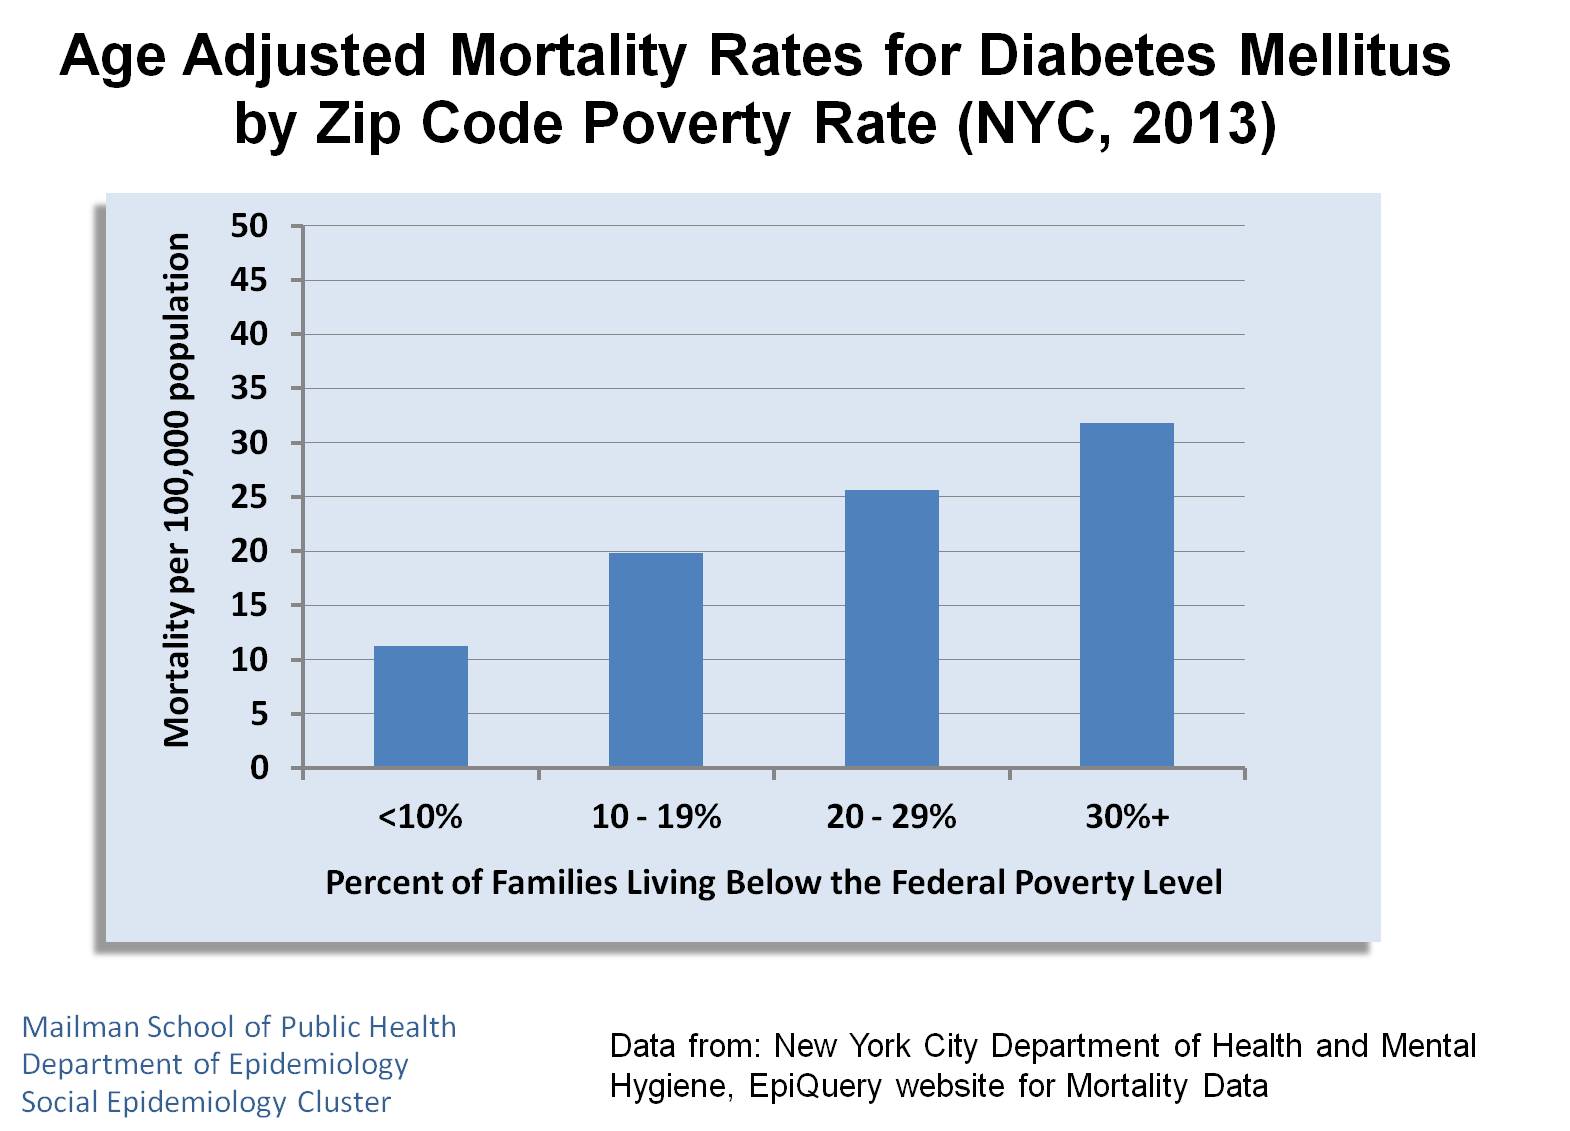
The first set of slides (9 slides) has been posted and document the differences in age adjusted mortality rates in NYC (2013) for major causes of death by Zip code poverty rate. For each cause of death the mortality rate increases with Zip code level poverty rate (% of families living below the Federal Poverty Line).
More decks of slides will be posted on a regular basis.