
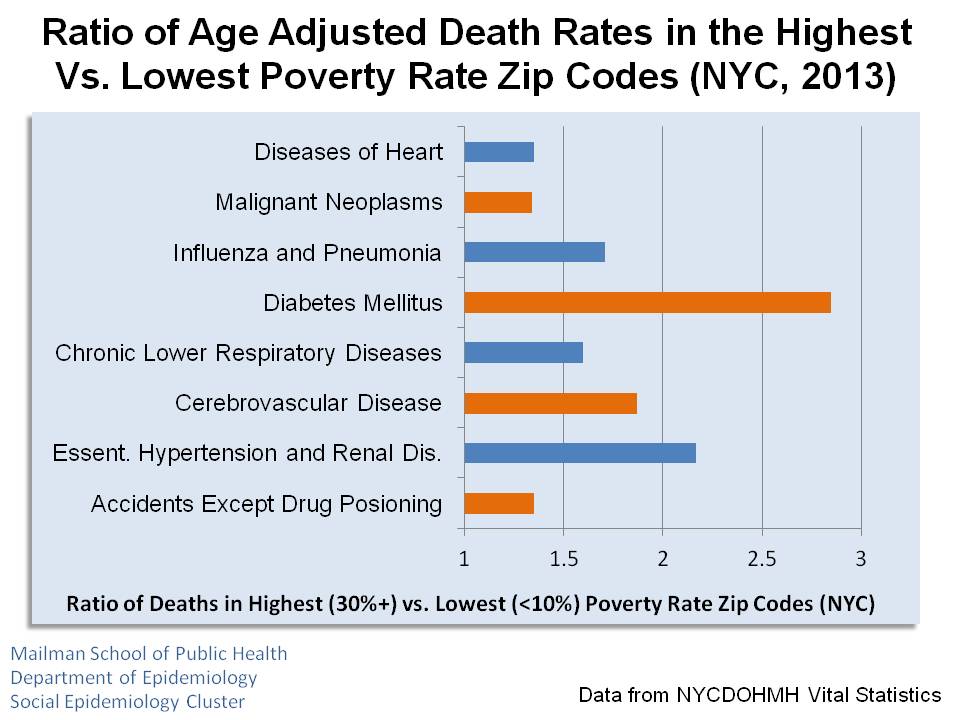
 This slide deck (8 slides) includes graphs documenting the differences in age adjusted mortality rates in NYC (2013) for major causes of death by Zip code poverty rate. For each cause of death the mortality rate increases with Zip code level poverty rate (% of families living below the Federal Poverty Line). The data are from the NYC Department of Health and Mental Hygiene Bureau of Vital Statics, analyzed using the Department’s EpiQuery Tool.
You can download the slide deck [HERE].