Follow Us On:


Faculty Publications on:

 PubMed Feed
- Partner incarceration, maternal substance use, and the mediating role of social support: A longitudinal analysis using the future of families and child wellbeing study
- Establishing registry-based mental health research in Latin America
- Adverse childhood experiences among black sexually minoritized men and Black transgender women in Chicago
- Disadvantaged groups have greater spatial access to pharmacies in New York state
- Direct potable reuse and birth defects prevalence in Texas: An augmented synthetic control method analysis of data from a population-based birth defects registry
- Screening mammography frequency following dense breast notification among a predominantly Hispanic/Latina screening cohort
- Neighborhood violent crime exposure is associated with PrEP non-use among black sexually minoritized men and transgender women: A GPS Study
- Police Harassment and Psychiatric, Sexual, and Substance Use Risk Among Black Sexual Minority Men and Black Transgender Women in the HIV Prevention Trials 061 Cohort
- Interstate Highway Connections and Traced Gun Transfers Between the 48 Contiguous United States
- Population Neuroscience: Understanding Concepts of Generalizability and Transportability and Their Application to Improving the Public's Health
Category Archives: Info-Graphix
Maintaining patient privacy while geocoding patient addresses: Do Not Use R to Geocode!
Imagine if a clinical researcher were to disclose a list of patient addresses to a third-party – government agency, for profit company or not-for-profit entity – that was outside of their hospital or health system. Imagine the researcher then publicly … Continue reading
Posted in Info-Graphix, Methods, Privacy
Leave a comment
Mapping Food Insecurity During the COVID-19 Pandemic
Prior to the COVID-19 pandemic, 11% of households and nearly 16% of families with children were food insecure. With schools closed and families out of work, food insecurity rates are expected to skyrocket in the coming months. During the crisis, … Continue reading
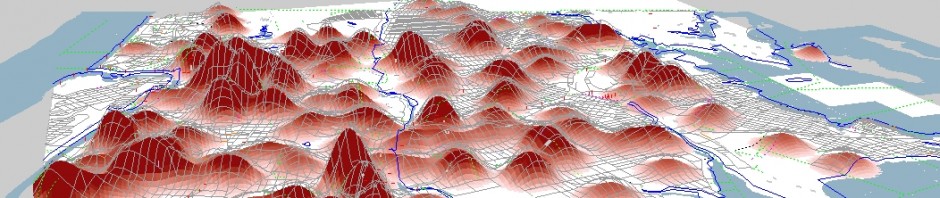
Mapping Populations at Risk for Severe COVID-19, continued
The Built Environment and Health Research Group’s geographer extraordinaire, James Quinn, built a new version of their interactive mapping tool for severe COVID-19. The map depicts populations at high risk of severe COVID-19 due to older age or underlying health … Continue reading
Networks of Opportunity for Child Wellbeing (NOW) Convening
Dr. Suglia recently attended the Networks of Opportunity for Child Wellbeing (NOW) Convening, where she presented her work on the neighborhood social environment and obesity prevention. To effectively prevent obesity in the US, this work proposes that rather than continue … Continue reading
Info-Graphic: Obesity and Changes in the Food Environment
Coincidental with the NY Times article this morning on food companies funding scientific research and advocacy to shift the focus of obesity prevention to physical activity, this weekend we posted a slide deck of info-graphix on obesity and changes in the … Continue reading
Posted in Economic, Info-Graphix
Leave a comment
Mass Incarceration Info-Graphix
We just released a comprehensive PowerPoint slide deck on Mass Incarceration statistics, please feel free to use these slides. Since most people sent to prison are eventually released, and most “corrections” actually happens in the community through parole and probation, it’s … Continue reading
Posted in Info-Graphix, Mass Incarceration
Leave a comment
Changes in Food Prices
The USDA Economic Research Service just released interesting data and analyses on changes in inflation-adjusted food prices from 1985 to 2014. The price of fresh fruit and vegetables has increased and the price of fats and oils and sugar and sweets … Continue reading
Posted in Economic, Info-Graphix, Socioeconomic Status
1 Comment
Info-Graphix Library
One of the goals of the Social Epidemiology Cluster, and this blog, is to make the case that social disparities are a critical determinant of health and well being. To propel this argument forward we are building a library of … Continue reading
Posted in Info-Graphix
Leave a comment