
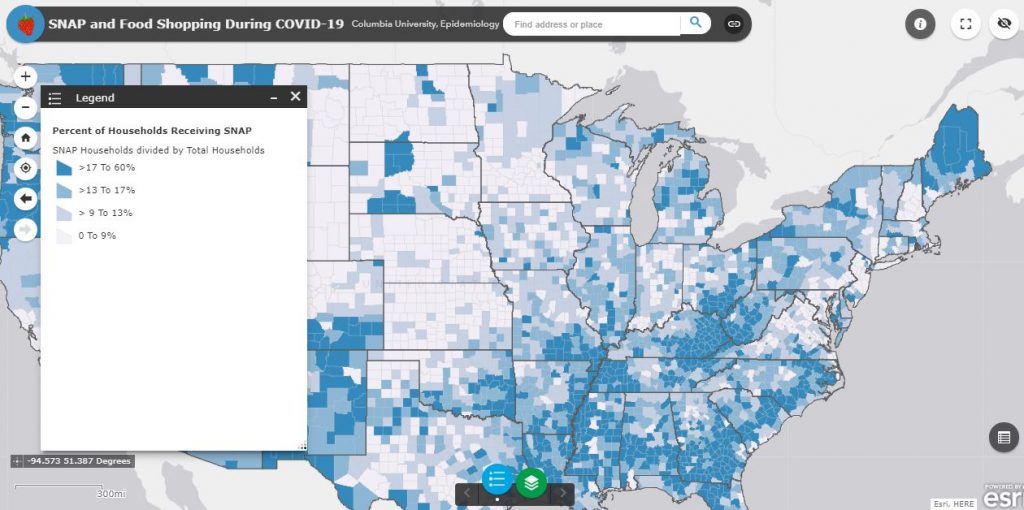
Prior to the COVID-19 pandemic, 11% of households and nearly 16% of families with children were food insecure. With schools closed and families out of work, food insecurity rates are expected to skyrocket in the coming months. During the crisis, food store shelves have frequently been empty due to bulk purchasing and an increase in at-home meal consumption. In an effort to ensure food is available for SNAP shoppers when they receive their monthly benefits, social media campaigns have encouraged non-SNAP shoppers to avoid food shopping during SNAP distribution dates. This is a particular concern in counties with large SNAP populations and in states with only a few SNAP distribution days per month (e.g., Nevada, Virginia, New Jersey). To inform these efforts, Dr. Eliza Kinsey, a post-doctoral researcher with the Social and Spatial Epi Unit, developed a web mapping tool of SNAP distribution schedules and participation rates by county. This tool is intended to be used, both by household food shoppers and by policy-makers in designing strategic efforts to combat the food insecurity and nutrition challenges brought on by the COVID-19 crisis.
The maps use current SNAP schedule distribution information and 2018 participation counts. Dr. Kinsey plans to update the mapping tool regularly with pertinent SNAP participation changes and unemployment data.
Food insecurity in America