Stacked bars can be used when an experimenter measures multiple dependent variables. The stacked bar displays distinct measures on a graph with each DV measure stacked on top of each other for each probe. In this example, we teach you how to make a multiple probe design with stacked bars.
SCROLL DOWN TO LEARN MORE ABOUT THE DESIGN
Video Instruction
Need to know how to set up the instruction?
Additional Information About Stacked Bars
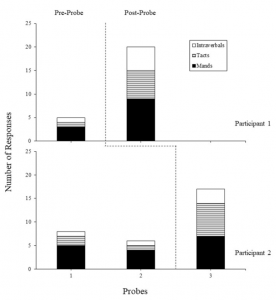 A multiple probe graph with stacked bars is a clear way to illustrate a multiple probe design (see standard multiple probe description above) in which there are multiple related dependent variables (e.g. mands, tacts, intraverbals, sequelics) being represented. Here, the count of each behavior is represented in a distinct bar by a given color or pattern and the bars of each behavior are stacked on top of one another, such that the total height of the bar is the total count of any behavior occurring
Examples